A cartesian chart. More...
#include <Wt/Chart/WCartesianChart>
Public Member Functions | |
| WCartesianChart (WContainerWidget *parent=0) | |
| Creates a new cartesian chart. More... | |
| WCartesianChart (ChartType type, WContainerWidget *parent=0) | |
| Creates a new cartesian chart. More... | |
| void | setType (ChartType type) |
| Sets the chart type. More... | |
| ChartType | type () const |
| Returns the chart type. More... | |
| void | setOrientation (Orientation orientation) |
| Sets the chart orientation. More... | |
| Orientation | orientation () const |
| Returns the chart orientation. More... | |
| void | setXSeriesColumn (int modelColumn) |
| Sets the the model column for the X series. More... | |
| void | setTextPen (const WPen &pen) |
| set the pen used to render the labels More... | |
| int | XSeriesColumn () const |
| Returns the model column for the X series. More... | |
| void | addSeries (const WDataSeries &series) |
| Adds a data series. More... | |
| void | addSeries (WDataSeries *series) |
| Adds a data series. More... | |
| void | removeSeries (int modelColumn) |
| Removes a data series. More... | |
| void | removeSeries (WDataSeries *series) |
| Removes a data series. More... | |
| void | setSeries (const std::vector< WDataSeries > &series) |
| Sets all data series. More... | |
| void | setSeries (const std::vector< WDataSeries *> &series) |
| Sets all data series. More... | |
| WDataSeries & | series (int modelColumn) |
| Returns a data series corresponding to a data column. More... | |
| const WDataSeries & | series (int modelColumn) const |
| Returns a data series corresponding to a data column. More... | |
| const std::vector< WDataSeries * > & | series () const |
| Returns a list with the current data series. More... | |
| WAxis & | axis (Axis axis) |
| Returns a chart axis. More... | |
| const WAxis & | axis (Axis axis) const |
| Accesses a chart axis. More... | |
| void | setAxis (WAxis *waxis, Axis axis) |
| Sets an axis. More... | |
| std::vector< WAxis * > | xAxes () |
| Returns a vector of all X axes associated with this chart. More... | |
| std::vector< const WAxis * > | xAxes () const |
| Returns a vector of all X axes associated with this chart. More... | |
| std::vector< WAxis * > | yAxes () |
| Returns a vector of all Y axes associated with this chart. More... | |
| std::vector< const WAxis * > | yAxes () const |
| Returns a vector of all Y axes associated with this chart. More... | |
| int | xAxisCount () const |
| Returns the number of X axes associated with this chart. | |
| int | yAxisCount () const |
| Returns the number of Y axes associated with this chart. | |
| WAxis & | xAxis (int i) |
| Retrieves the X axis at index i. More... | |
| const WAxis & | xAxis (int i) const |
| Retrieves the X axis at index i. More... | |
| WAxis & | yAxis (int i) |
| Retrieves the Y axis at index i. More... | |
| const WAxis & | yAxis (int i) const |
| Retrieves the Y axis at index i. More... | |
| int | addXAxis (WAxis *waxis) |
| Adds a X axis to this chart. More... | |
| int | addYAxis (WAxis *waxis) |
| Adds a Y axis to this chart. More... | |
| void | removeXAxis (int xAxisId) |
| Removes the X axis with the given id. More... | |
| void | removeYAxis (int yAxisId) |
| Removes the Y axis with the given id. More... | |
| void | clearXAxes () |
| Clears all X axes. More... | |
| void | clearYAxes () |
| Clears all Y axes. More... | |
| void | setBarMargin (double margin) |
| Sets the margin between bars of different series. More... | |
| double | barMargin () const |
| Returns the margin between bars of different series. More... | |
| void | setLegendEnabled (bool enabled) |
| Enables the legend. More... | |
| bool | isLegendEnabled () const |
| Returns whether the legend is enabled. More... | |
| void | setLegendLocation (LegendLocation location, Side side, AlignmentFlag alignment) |
| Configures the legend location. More... | |
| void | setLegendStyle (const WFont &font, const WPen &border, const WBrush &background) |
| Configures the legend decoration. More... | |
| LegendLocation | legendLocation () const |
| Returns the legend location. More... | |
| Side | legendSide () const |
| Returns the legend side. More... | |
| AlignmentFlag | legendAlignment () const |
| Returns the legend alignment. More... | |
| int | legendColumns () const |
| Returns the legend columns. More... | |
| WLength | legendColumnWidth () const |
| Returns the legend column width. More... | |
| WFont | legendFont () const |
| Returns the legend font. More... | |
| WPen | legendBorder () const |
| Returns the legend border pen. More... | |
| WBrush | legendBackground () const |
| Returns the legend background brush. More... | |
| void | setLegendColumns (int columns, const WLength &width) |
| Configures multiple legend columns. More... | |
| virtual void | paint (WPainter &painter, const WRectF &rectangle=WRectF()) const WT_CXX11ONLY(override) |
| Paint the chart in a rectangle of the given painter. More... | |
| virtual void | drawMarker (const WDataSeries &series, WPainterPath &result) const |
| Draws the marker for a given data series. More... | |
| virtual void | renderLegendIcon (WPainter &painter, const WPointF &pos, const WDataSeries &series) const |
| Renders the legend icon for a given data series. More... | |
| virtual void | renderLegendItem (WPainter &painter, const WPointF &pos, const WDataSeries &series) const |
| Renders the legend item for a given data series. More... | |
| WPointF | mapFromDevice (const WPointF &point, Axis ordinateAxis=OrdinateAxis) const |
| Maps from device coordinates to model coordinates. More... | |
| WPointF | mapFromDevice (const WPointF &point, int ordinateAxis) const |
| Maps from device coordinates to model coordinates. More... | |
| WPointF | mapFromDeviceWithoutTransform (const WPointF &point, Axis ordinateAxis=OrdinateAxis) const |
| Maps from device coordinates to model coordinates, ignoring the current zoom range. More... | |
| WPointF | mapFromDevice (const WPointF &point, const WAxis &xAxis, const WAxis &yAxis) const |
| Maps from device coordinates to model coordinates. More... | |
| WPointF | mapFromDeviceWithoutTransform (const WPointF &point, int ordinateAxis) const |
| Maps from device coordinates to model coordinates, ignoring the current zoom range. More... | |
| WPointF | mapFromDeviceWithoutTransform (const WPointF &point, const WAxis &xAxis, const WAxis &yAxis) const |
| Maps from device coordinates to model coordinates, ignoring the current zoom range. More... | |
| WPointF | mapToDevice (const boost::any &xValue, const boost::any &yValue, Axis axis=OrdinateAxis, int xSegment=0, int ySegment=0) const |
| Maps model values onto chart coordinates. More... | |
| WPointF | mapToDevice (const boost::any &xValue, const boost::any &yValue, int yAxis, int xSegment=0, int ySegment=0) const |
| Maps model values onto chart coordinates. More... | |
| WPointF | mapToDevice (const boost::any &xValue, const boost::any &yValue, const WAxis &xAxis, const WAxis &yAxis, int xSegment=0, int ySegment=0) const |
| Maps model values onto chart coordinates. More... | |
| WPointF | mapToDeviceWithoutTransform (const boost::any &xValue, const boost::any &yValue, Axis axis=OrdinateAxis, int xSegment=0, int ySegment=0) const |
| Maps model values onto chart coordinates, ignoring the current zoom range. More... | |
| WPointF | mapToDeviceWithoutTransform (const boost::any &xValue, const boost::any &yValue, int yAxis, int xSegment=0, int ySegment=0) const |
| Maps model values onto chart coordinates, ignoring the current zoom range. More... | |
| WPointF | mapToDeviceWithoutTransform (const boost::any &xValue, const boost::any &yValue, const WAxis &xAxis, const WAxis &yAxis, int xSegment=0, int ySegment=0) const |
| Maps model values onto chart coordinates, ignoring the current zoom range. More... | |
| bool | initLayout (const WRectF &rectangle=WRectF(), WPaintDevice *device=0) const |
| Initializes the chart layout. More... | |
| WWidget * | createLegendItemWidget (int index) |
| Creates a widget which renders the a legend item. More... | |
| virtual void | addDataPointArea (const WDataSeries &series, int xRow, int xColumn, WAbstractArea *area) |
| Adds a data point area (used for displaying e.g. tooltips). More... | |
| void | setAxisPadding (int axisPadding) |
| Sets the padding between the chart area and the axes. More... | |
| int | axisPadding () const |
| Returns the padding between the chart area and the axes. More... | |
| void | setBorderPen (const WPen &pen) |
| Sets the pen of the border to be drawn around the chart area. More... | |
| const WPen & | borderPen () const |
| Returns the pen used to draw the border around the chart area. More... | |
| void | addCurveLabel (const CurveLabel &label) |
| Add a curve label. More... | |
| void | setCurveLabels (const std::vector< CurveLabel > &labels) |
| Configure all curve labels at once. More... | |
| void | clearCurveLabels () |
| Clear all curve labels. More... | |
| const std::vector< CurveLabel > & | curveLabels () const |
| Get all of the registered curve labels. More... | |
Client side interaction | |
These methods allow to activate the client side interactive features of a WCartesianChart.
| |
| bool | isInteractive () const |
| Returns whether this chart is interactive. More... | |
| void | setZoomEnabled (bool zoom=true) |
| Enables zoom functionality. More... | |
| bool | zoomEnabled () const |
| Returns whether zoom is enabled. More... | |
| void | setPanEnabled (bool pan=true) |
| Enables pan functionality. More... | |
| bool | panEnabled () const |
| Returns whether pan is enabled. More... | |
| void | setCrosshairEnabled (bool crosshair=true) |
| Enables the crosshair functionality. More... | |
| bool | crosshairEnabled () const |
| Returns whether the crosshair is enabled. More... | |
| void | setCrosshairColor (const WColor &color) |
| Sets the crosshair color. More... | |
| const WColor & | crosshairColor () const |
| Returns the crosshair color. More... | |
| void | setCrosshairXAxis (int xAxis) |
| Sets the X axis to use for the crosshair. More... | |
| int | crosshairXAxis () const |
| Returns the X axis to use for the crosshair. | |
| void | setCrosshairYAxis (int yAxis) |
| Sets the Y axis to use for the crosshair. More... | |
| int | crosshairYAxis () const |
| Returns the Y axis to use for the crosshair. | |
| void | setFollowCurve (int modelColumn) |
| Enables the follow curve functionality for a data series. More... | |
| void | setFollowCurve (const WDataSeries *series) |
| Enabled the follow curve funtionality for a data series. More... | |
| void | disableFollowCurve () |
| Disable the follow curve functionality. More... | |
| const WDataSeries * | followCurve () const |
| Returns the curve that is to be followed. More... | |
| void | setRubberBandEffectEnabled (bool rubberBand=true) |
| Enables/disables the inertial scrolling and rubberband effect. More... | |
| bool | rubberBandEffectEnabled () const |
| Checks whether the rubberband effect is enabled. More... | |
| void | setWheelActions (WheelActions wheelActions) |
| Sets the mapping of mouse wheel actions for interactive charts. More... | |
| WheelActions | wheelActions () const |
| Returns the current mouse wheel actions for interactive charts. More... | |
| void | setSoftLabelClipping (bool enabled) |
| Enables or disables soft label clipping on all axes. More... | |
| void | setSeriesSelectionEnabled (bool enabled=true) |
| Sets whether series selection is enabled. More... | |
| bool | seriesSelectionEnabled () const |
| Returns whether series selection is enabled. More... | |
| Signal< const WDataSeries *, WPointF > & | seriesSelected () |
| A signal that notifies the selection of a new curve. More... | |
| void | setSelectedSeries (const WDataSeries *series) |
| Sets the series that is currently selected. More... | |
| const WDataSeries * | selectedSeries () const |
| Get the currently selected curve. More... | |
| void | setCurveManipulationEnabled (bool enabled=true) |
| Enable curve manipulation. More... | |
| bool | curveManipulationEnabled () const |
| Returns whether curve manipulation is enabled. More... | |
| void | setOnDemandLoadingEnabled (bool enabled) |
| Enable on-demand loading. More... | |
| bool | onDemandLoadingEnabled () const |
| Returns whether on-demand loading is enabled. More... | |
| void | setLoadingBackground (const WBrush &brush) |
| Set the background brush for the unloaded area. More... | |
| const WBrush & | loadingBackground () const |
| Returns the background brush for the unloaded area. More... | |
 Public Member Functions inherited from Wt::Chart::WAbstractChart Public Member Functions inherited from Wt::Chart::WAbstractChart | |
| virtual | ~WAbstractChart () |
| Destructor. | |
| void | setModel (WAbstractItemModel *model) |
| Sets the model. More... | |
| void | setModel (WAbstractChartModel *model) |
| Sets the model. More... | |
| WAbstractChartModel * | model () const |
| Returns the model. More... | |
| WAbstractItemModel * | itemModel () const |
| Returns the model. More... | |
| void | setBackground (const WBrush &background) |
| Sets a background for the chart. More... | |
| const WBrush & | background () const |
| Returns the background of the chart. More... | |
| void | setPalette (WChartPalette *palette) |
| Set a palette for the chart. More... | |
| WChartPalette * | palette () const |
| Returns the palette for the chart. More... | |
| void | setPlotAreaPadding (int padding, WFlags< Side > sides=All) |
| Set an internal margin for the main plot area. More... | |
| int | plotAreaPadding (Side side) const |
| Returns the internal margin for the main plot area. More... | |
| void | setAutoLayoutEnabled (bool enabled=true) |
| Configures the chart layout to be automatic. More... | |
| bool | isAutoLayoutEnabled () const |
| Returns whether chart layout is computed automatically. More... | |
| void | setTitle (const WString &title) |
| Set a chart title. More... | |
| const WString & | title () const |
| Return the chart title. More... | |
| void | setTitleFont (const WFont &titleFont) |
| Set the font for the chart title. More... | |
| const WFont & | titleFont () const |
| Returns the font for the chart title. More... | |
| Public Member Functions inherited from Wt::WPaintedWidget | |
| WPaintedWidget (WContainerWidget *parent=0) | |
| Create a new painted widget. | |
| ~WPaintedWidget () | |
| Destructor. | |
| void | setPreferredMethod (Method method) |
| Sets the preferred rendering method. More... | |
| Method | preferredMethod () const |
| Returns the preferred rendering method. More... | |
| void | update (WFlags< PaintFlag > flags=0) |
| Lets the widget repaint itself. More... | |
| virtual void | resize (const WLength &width, const WLength &height) |
| Resizes the widget. More... | |
| void | addArea (WAbstractArea *area) |
| Adds an interactive area. More... | |
| void | insertArea (int index, WAbstractArea *area) |
| Inserts an interactive area. More... | |
| void | removeArea (WAbstractArea *area) |
| Removes an interactive area. More... | |
| WAbstractArea * | area (int index) const |
| Returns the interactive area at the given index. More... | |
| const std::vector< WAbstractArea * > | areas () const |
| Returns the interactive areas set for this widget. More... | |
| JSlot & | repaintSlot () |
| A JavaScript slot that repaints the widget when triggered. More... | |
| Public Member Functions inherited from Wt::WInteractWidget | |
| WInteractWidget (WContainerWidget *parent=0) | |
| Create an InteractWidget with optional parent. | |
| EventSignal< WKeyEvent > & | keyWentDown () |
| Event signal emitted when a keyboard key is pushed down. More... | |
| EventSignal< WKeyEvent > & | keyPressed () |
| Event signal emitted when a "character" was entered. More... | |
| EventSignal< WKeyEvent > & | keyWentUp () |
| Event signal emitted when a keyboard key is released. More... | |
| EventSignal & | enterPressed () |
| Event signal emitted when enter was pressed. More... | |
| EventSignal & | escapePressed () |
| Event signal emitted when escape was pressed. More... | |
| EventSignal< WMouseEvent > & | clicked () |
| Event signal emitted when a mouse key was clicked on this widget. More... | |
| EventSignal< WMouseEvent > & | doubleClicked () |
| Event signal emitted when a mouse key was double clicked on this widget. More... | |
| EventSignal< WMouseEvent > & | mouseWentDown () |
| Event signal emitted when a mouse key was pushed down on this widget. More... | |
| EventSignal< WMouseEvent > & | mouseWentUp () |
| Event signal emitted when a mouse key was released on this widget. More... | |
| EventSignal< WMouseEvent > & | mouseWentOut () |
| Event signal emitted when the mouse went out of this widget. More... | |
| EventSignal< WMouseEvent > & | mouseWentOver () |
| Event signal emitted when the mouse entered this widget. More... | |
| EventSignal< WMouseEvent > & | mouseMoved () |
| Event signal emitted when the mouse moved over this widget. More... | |
| EventSignal< WMouseEvent > & | mouseDragged () |
| Event signal emitted when the mouse is dragged over this widget. More... | |
| EventSignal< WMouseEvent > & | mouseWheel () |
| Event signal emitted when the mouse scroll wheel was used. More... | |
| EventSignal< WTouchEvent > & | touchStarted () |
| Event signal emitted when a finger is placed on the screen. More... | |
| EventSignal< WTouchEvent > & | touchEnded () |
| Event signal emitted when a finger is removed from the screen. More... | |
| EventSignal< WTouchEvent > & | touchMoved () |
| Event signal emitted when a finger, which is already placed on the screen, is moved across the screen. More... | |
| EventSignal< WGestureEvent > & | gestureStarted () |
| Event signal emitted when a gesture is started. More... | |
| EventSignal< WGestureEvent > & | gestureChanged () |
| Event signal emitted when a gesture is changed. More... | |
| EventSignal< WGestureEvent > & | gestureEnded () |
| Event signal emitted when a gesture is ended. More... | |
| void | setDraggable (const std::string &mimeType, WWidget *dragWidget=0, bool isDragWidgetOnly=false, WObject *sourceWidget=0) |
| Configure dragging for drag and drop. More... | |
| void | unsetDraggable () |
| Disable drag & drop for this widget. More... | |
| void | setMouseOverDelay (int delay) |
| Sets a delay for the mouse over event. More... | |
| int | mouseOverDelay () const |
| Returns the mouse over signal delay. More... | |
| virtual void | setPopup (bool popup) |
| Lets the widget overlay over other sibling widgets. More... | |
| virtual void | load () |
| Loads content just before the widget is used. More... | |
| virtual bool | isEnabled () const |
| Returns whether the widget is enabled. More... | |
| Public Member Functions inherited from Wt::WWebWidget | |
| WWebWidget (WContainerWidget *parent=0) | |
| Construct a WebWidget with a given parent. More... | |
| virtual void | setPositionScheme (PositionScheme scheme) |
| Sets the CSS position scheme. More... | |
| virtual PositionScheme | positionScheme () const |
| Returns the CSS position scheme. More... | |
| virtual void | setOffsets (const WLength &offset, WFlags< Side > sides=All) |
| Sets CSS offsets for a non-statically positioned widget. More... | |
| virtual WLength | offset (Side s) const |
| Returns a CSS offset. More... | |
| virtual WLength | width () const |
| Returns the width. More... | |
| virtual WLength | height () const |
| Returns the height. More... | |
| virtual void | setMinimumSize (const WLength &width, const WLength &height) |
| Sets a minimum size. More... | |
| virtual WLength | minimumWidth () const |
| Returns the minimum width. More... | |
| virtual WLength | minimumHeight () const |
| Returns the minimum height. More... | |
| virtual void | setMaximumSize (const WLength &width, const WLength &height) |
| Sets a maximum size. More... | |
| virtual WLength | maximumWidth () const |
| Returns the maximum width. More... | |
| virtual WLength | maximumHeight () const |
| Returns the maximum height. More... | |
| virtual void | setLineHeight (const WLength &height) |
| Sets the CSS line height for contained text. | |
| virtual WLength | lineHeight () const |
| Returns the CSS line height for contained text. More... | |
| virtual void | setFloatSide (Side s) |
| Specifies a CSS float side. More... | |
| virtual Side | floatSide () const |
| Returns the CSS float side. More... | |
| virtual void | setClearSides (WFlags< Side > sides) |
| Sets the sides that should be cleared of floats. More... | |
| virtual WFlags< Side > | clearSides () const |
| Returns the sides that should remain empty. More... | |
| virtual void | setMargin (const WLength &margin, WFlags< Side > sides=All) |
| Sets CSS margins around the widget. More... | |
| virtual WLength | margin (Side side) const |
| Returns a CSS margin set. More... | |
| virtual void | setHiddenKeepsGeometry (bool enabled) |
| Sets whether the widget keeps its geometry when hidden. More... | |
| virtual bool | hiddenKeepsGeometry () const |
| Returns whether the widget keeps its geometry when hidden. More... | |
| virtual void | setHidden (bool hidden, const WAnimation &animation=WAnimation()) |
| Hides or shows the widget. More... | |
| virtual bool | isHidden () const |
| Returns whether the widget is set hidden. More... | |
| virtual bool | isVisible () const |
| Returns whether the widget is visible. More... | |
| virtual void | setDisabled (bool disabled) |
| Sets whether the widget is disabled. More... | |
| virtual bool | isDisabled () const |
| Returns whether the widget is set disabled. More... | |
| virtual bool | isPopup () const |
| Returns whether the widget is overlayed. More... | |
| virtual void | setInline (bool isInline) |
| Sets whether the widget is displayed inline or as a block. More... | |
| virtual bool | isInline () const |
| Returns whether the widget is displayed inline or as block. More... | |
| virtual void | setDecorationStyle (const WCssDecorationStyle &style) |
| Sets a CSS decoration style. More... | |
| virtual WCssDecorationStyle & | decorationStyle () |
| Returns the decoration style of this widget. More... | |
| virtual void | setStyleClass (const WString &styleClass) |
| Sets (one or more) CSS style classes. More... | |
| virtual WString | styleClass () const |
| Returns the CSS style class. More... | |
| virtual void | addStyleClass (const WString &styleClass, bool force=false) |
| Adds a CSS style class. More... | |
| virtual void | removeStyleClass (const WString &styleClass, bool force=false) |
| Removes a CSS style class. More... | |
| virtual bool | hasStyleClass (const WString &styleClass) const |
| Returns whether the widget has a style class. | |
| virtual void | setVerticalAlignment (AlignmentFlag alignment, const WLength &length=WLength()) |
| Sets the vertical alignment. More... | |
| virtual AlignmentFlag | verticalAlignment () const |
| Returns the vertical alignment. More... | |
| virtual WLength | verticalAlignmentLength () const |
| Returns the fixed vertical alignment that was set. More... | |
| virtual void | setToolTip (const WString &text, TextFormat textFormat=PlainText) |
| Sets a tooltip. More... | |
| virtual void | setDeferredToolTip (bool enable, TextFormat textFormat=PlainText) |
| Enable deferred tooltip. More... | |
| virtual WString | toolTip () const |
| Returns the tooltip. | |
| virtual void | refresh () |
| Refresh the widget. More... | |
| virtual void | setAttributeValue (const std::string &name, const WString &value) |
| Sets an attribute value. More... | |
| virtual WString | attributeValue (const std::string &name) const |
| Returns an attribute value. More... | |
| virtual void | setJavaScriptMember (const std::string &name, const std::string &value) |
| Sets a JavaScript member. More... | |
| virtual std::string | javaScriptMember (const std::string &name) const |
| Returns the value of a JavaScript member. More... | |
| virtual void | callJavaScriptMember (const std::string &name, const std::string &args) |
| Calls a JavaScript member. More... | |
| virtual bool | loaded () const |
| Returns whether this widget has been loaded. More... | |
| virtual void | setId (const std::string &id) |
| Sets the CSS Id. More... | |
| virtual WWidget * | find (const std::string &name) |
| Finds a descendent widget by name. More... | |
| virtual WWidget * | findById (const std::string &id) |
| Finds a descendent widget by id. | |
| virtual void | setSelectable (bool selectable) |
| Sets as selectable. More... | |
| virtual void | doJavaScript (const std::string &javascript) |
| Executes the given JavaScript statements when the widget is rendered or updated. More... | |
| virtual const std::string | id () const |
| Returns the (unique) identifier for this object. More... | |
| void | setLoadLaterWhenInvisible (bool) |
| Change the way the widget is loaded when invisible. More... | |
| std::string | htmlTagName () const |
| returns the current html tag name More... | |
| void | setHtmlTagName (const std::string &tag) |
| set the custom HTML tag name More... | |
| const std::vector< WWidget * > & | children () const |
| Returns contained widgets. More... | |
| Signal & | childrenChanged () |
| Signal emitted when children have been added or removed. More... | |
| virtual void | setCanReceiveFocus (bool enabled) |
| Sets whether the widget can receive focus. More... | |
| virtual bool | canReceiveFocus () const |
| Returns whether the widget can receive focus. More... | |
| virtual bool | setFirstFocus () |
| Set focus on the widget's first descendant. More... | |
| virtual void | setFocus (bool focus) |
| Sets focus. More... | |
| virtual bool | hasFocus () const |
| Returns whether the widget currently has the focus. | |
| virtual void | setTabIndex (int index) |
| Sets the tab index. More... | |
| virtual int | tabIndex () const |
| Returns the tab index. More... | |
| EventSignal & | blurred () |
| Signal emitted when the widget lost focus. More... | |
| EventSignal & | focussed () |
| Signal emitted when the widget recieved focus. More... | |
| virtual bool | scrollVisibilityEnabled () const WT_CXX11ONLY(final override) |
| Returns whether scroll visibility detection is enabled for this widget. More... | |
| virtual void | setScrollVisibilityEnabled (bool enabled) WT_CXX11ONLY(final override) |
| Sets whether scroll visibility detection is enabled for this widget. More... | |
| virtual int | scrollVisibilityMargin () const WT_CXX11ONLY(final override) |
| Returns the margin around the viewport within which the widget is considered visible. More... | |
| virtual void | setScrollVisibilityMargin (int margin) WT_CXX11ONLY(final override) |
| Sets the margin around the viewport within which the widget is considered visible. More... | |
| virtual Signal< bool > & | scrollVisibilityChanged () WT_CXX11ONLY(final override) |
| Signal triggered when the scroll visibility of this widget changes. More... | |
| virtual bool | isScrollVisible () const WT_CXX11ONLY(final override) |
| Returns whether this widget is currently considered scroll visible. More... | |
| virtual void | setThemeStyleEnabled (bool enabled) |
| Sets whether theme styling for a widget is enabled or disabled. More... | |
| virtual bool | isThemeStyleEnabled () const |
| Returns whether this widget is currently styled by the chosen theme. More... | |
| Public Member Functions inherited from Wt::WWidget | |
| virtual | ~WWidget () |
| Destructor. More... | |
| WWidget * | parent () const |
| Returns the parent widget. More... | |
| virtual void | removeChild (WObject *child) |
| Removes a child object. More... | |
| void | setWidth (const WLength &width) |
| Sets the width. More... | |
| void | setHeight (const WLength &height) |
| Sets the height. More... | |
| virtual void | positionAt (const WWidget *widget, Orientation orientation=Vertical) |
| Positions a widget next to another widget. More... | |
| virtual void | toggleStyleClass (const WString &styleClass, bool add, bool force=false) |
| Toggles a CSS style class. | |
| std::string | jsRef () const |
| Returns a JavaScript expression to the corresponding DOM node. More... | |
| void | setFocus () |
| Sets focus. More... | |
| virtual void | acceptDrops (const std::string &mimeType, const WString &hoverStyleClass=WString()) |
| Sets a mime type to be accepted for dropping. More... | |
| virtual void | stopAcceptDrops (const std::string &mimeType) |
| Indicates that a mime type is no longer accepted for dropping. More... | |
| virtual void | setObjectName (const std::string &name) |
| Sets an object name. More... | |
| virtual void | htmlText (std::ostream &out) |
| Streams the (X)HTML representation. More... | |
| bool | isRendered () const |
| Returns whether the widget is rendered. More... | |
| void | hide () |
| Hides the widget. More... | |
| void | animateHide (const WAnimation &animation) |
| Hides the widget using an animation. More... | |
| void | show () |
| Shows the widget. More... | |
| void | animateShow (const WAnimation &animation) |
| Shows the widget using an animation. More... | |
| void | enable () |
| Enables the widget. More... | |
| void | disable () |
| Disable thes widget. More... | |
| bool | layoutSizeAware () const |
| Returns whether the widget is layout size aware. More... | |
| Public Member Functions inherited from Wt::WObject | |
| WObject (WObject *parent=0) | |
| Create a WObject with a given parent object. More... | |
| virtual | ~WObject () |
| Destructor. More... | |
| virtual std::string | objectName () const |
| Returns the object name. More... | |
| void | resetLearnedSlots () |
| Resets learned stateless slot implementations. More... | |
| template<class T > | |
| void | resetLearnedSlot (void(T::*method)()) |
| Resets a learned stateless slot implementation. More... | |
| template<class T > | |
| WStatelessSlot * | implementStateless (void(T::*method)()) |
| Declares a slot to be stateless and learn client-side behaviour on first invocation. More... | |
| template<class T > | |
| WStatelessSlot * | implementStateless (void(T::*method)(), void(T::*undoMethod)()) |
| Declares a slot to be stateless and learn client-side behaviour in advance. More... | |
| void | isNotStateless () |
| Marks the current function as not stateless. More... | |
| template<class T > | |
| WStatelessSlot * | implementJavaScript (void(T::*method)(), const std::string &jsCode) |
| Provides a JavaScript implementation for a method. More... | |
| void | addChild (WObject *child) |
| Adds a child object. More... | |
| const std::vector< WObject * > & | children () const |
| Returns the children. | |
| WObject * | parent () const |
| Returns the parent object. | |
Protected Member Functions | |
| virtual void | render (WFlags< RenderFlag > flags) WT_CXX11ONLY(override) |
| Renders the widget. More... | |
| WTransform | zoomRangeTransform (int yAxis=0) const |
| Returns the current zoom range transform. More... | |
| WTransform | zoomRangeTransform (const WAxis &xAxis, const WAxis &yAxis) const |
| Returns the current zoom range transform. More... | |
Rendering logic | |
| virtual void | paintEvent (WPaintDevice *paintDevice) WT_CXX11ONLY(override) |
| Paints the widget. More... | |
| virtual void | render (WPainter &painter, const WRectF &rectangle) const |
| Renders the chart. More... | |
| virtual WPointF | map (double xValue, double yValue, Axis yAxis=OrdinateAxis, int currentXSegment=0, int currentYSegment=0) const |
| Map (x, y) value pair to chart coordinates coordinates. More... | |
| virtual WPointF | map (double xValue, double yValue, int yAxis, int currentXSegment=0, int currentYSegment=0) const |
| Map (x, y) value pair to chart coordinates coordinates. More... | |
| virtual WPointF | map (double xValue, double yValue, const WAxis &xAxis, const WAxis &yAxis, int currentXSegment=0, int currentYSegment=0) const |
| Map (x, y) value pair to chart coordinates coordinates. More... | |
| virtual void | renderLabel (WPainter &painter, const WString &text, const WPointF &pos, WFlags< AlignmentFlag > flags, double angle, int margin) const |
| Utility function for rendering text. More... | |
| WPointF | hv (double x, double y) const |
| Conversion between chart and painter coordinates. More... | |
| WPointF | hv (const WPointF &f) const |
| Conversion between chart and painter coordinates. More... | |
| WRectF | hv (const WRectF &f) const |
| Conversion between chart and painter coordinates. More... | |
| WRectF | chartSegmentArea (const WAxis &yAxis, int xSegment, int ySegment) const |
| Returns the segment area for a combination of X and Y segments. More... | |
| WRectF | chartSegmentArea (const WAxis &xAxis, const WAxis &yAxis, int xSegment, int ySegment) const |
| Returns the segment area for a combination of X and Y segments. More... | |
| virtual void | calcChartArea () const |
| Calculates the chart area. More... | |
| virtual bool | prepareAxes (WPaintDevice *device) const |
| Prepares the axes for rendering. More... | |
| virtual void | renderBackground (WPainter &painter) const |
| Renders the background. More... | |
| virtual void | renderAxes (WPainter &painter, WFlags< AxisProperty > properties) const |
| Renders one or more properties of the axes. More... | |
| virtual void | renderBorder (WPainter &painter) const |
| Renders the border of the chart area. More... | |
| virtual void | renderCurveLabels (WPainter &painter) const |
| Renders the curve labels. More... | |
| virtual void | renderSeries (WPainter &painter) const |
| Renders all series data, including value labels. More... | |
| virtual void | renderLegend (WPainter &painter) const |
| Renders the (default) legend and chart titles. More... | |
| virtual void | renderAxis (WPainter &painter, const WAxis &axis, WFlags< AxisProperty > properties) const |
| Renders properties of one axis. More... | |
| virtual void | renderGrid (WPainter &painter, const WAxis &axis) const |
| Renders grid lines along the ticks of the given axis. More... | |
| virtual void | renderOther (WPainter &painter) const |
| Renders other, user-defined things. More... | |
| int | calcNumBarGroups () |
| Calculates the total number of bar groups. | |
| Protected Member Functions inherited from Wt::WPaintedWidget | |
| WJavaScriptHandle< WTransform > | createJSTransform () |
| Create a WTransform that is accessible from JavaScript, associated with this WPaintedWidget. | |
| WJavaScriptHandle< WBrush > | createJSBrush () |
| Create a WBrush that is accessible from JavaScript, associated with this WPaintedWidget. | |
| WJavaScriptHandle< WPen > | createJSPen () |
| Create a WPen that is accessible from JavaScript, associated with this WPaintedWidget. | |
| WJavaScriptHandle< WPainterPath > | createJSPainterPath () |
| Create a WPainterPath that is accessible from JavaScript, associated with this WPaintedWidget. | |
| WJavaScriptHandle< WRectF > | createJSRect () |
| Create a WRectF that is accessible from JavaScript, associated with this WPaintedWidget. | |
| WJavaScriptHandle< WPointF > | createJSPoint () |
| Create a WPointF that is accessible from JavaScript, associated with this WPaintedWidget. | |
| virtual void | layoutSizeChanged (int width, int height) |
| Virtual method that indicates a size change. More... | |
| virtual Method | getMethod () const |
| Returns the actual method used for rendering. More... | |
| virtual WPaintDevice * | createPaintDevice () const |
| Creates a paint device. More... | |
| virtual void | enableAjax () |
| Progresses to an Ajax-enabled widget. More... | |
| std::string | objJsRef () const |
| Returns a JavaScript reference to the client side representation of the WPaintedWidget. More... | |
| Protected Member Functions inherited from Wt::WInteractWidget | |
| virtual void | propagateSetEnabled (bool enabled) |
| Propagates that a widget was enabled or disabled through children. More... | |
| Protected Member Functions inherited from Wt::WWebWidget | |
| virtual WStatelessSlot * | getStateless (Method method) |
| On-demand stateless slot implementation. More... | |
| Protected Member Functions inherited from Wt::WWidget | |
| void | setLayoutSizeAware (bool sizeAware) |
| Sets the widget to be aware of its size set by a layout manager. More... | |
| WWidget (WContainerWidget *parent=0) | |
| Creates a widget. More... | |
| virtual void | dropEvent (WDropEvent dropEvent) |
| Handles a drop event. More... | |
| virtual int | boxPadding (Orientation orientation) const |
| Returns the widget's built-in padding. More... | |
| virtual int | boxBorder (Orientation orientation) const |
| Returns the widget's built-in border width. More... | |
| void | scheduleRender (WFlags< RepaintFlag > flags=0) |
| Schedules rerendering of the widget. More... | |
Additional Inherited Members | |
| Public Types inherited from Wt::WPaintedWidget | |
| enum | Method { InlineSvgVml, HtmlCanvas, PngImage } |
| Enumeration that indicates a rendering method. More... | |
| Public Types inherited from Wt::WObject | |
| typedef void(WObject::* | Method) () |
| Typedef for a WObject method without arguments. | |
| Static Public Member Functions inherited from Wt::WWebWidget | |
| static WString | escapeText (const WString &text, bool newlinesToo=false) |
| Escape HTML control characters in the text, to display literally (deprecated). More... | |
| static std::string & | escapeText (std::string &text, bool newlinestoo=false) |
| Escape HTML control characters in the text, to display literally (deprecated). More... | |
| static bool | removeScript (WString &text) |
| Remove tags/attributes from text that are not passive (deprecated). More... | |
| static std::string | jsStringLiteral (const std::string &v, char delimiter='\'') |
| Turn a UTF8 encoded string into a JavaScript string literal. More... | |
| Static Public Member Functions inherited from Wt::WWidget | |
| static WString | tr (const char *key) |
| Short hand for WString::tr() More... | |
| Static Protected Member Functions inherited from Wt::WObject | |
| static WObject * | sender () |
| Returns the sender of the current slot call. More... | |
Detailed Description
A cartesian chart.
A cartesian chart is a chart that uses X and Y axes. It can display one or multiple data series, which each may be rendered using bars, lines, areas, or points.
To use a cartesian chart, the minimum you need to do is set a model using setModel(), set the model column that holds the X data using setXSeriesColumn(int modelColumn), and add one or more series using addSeries(WDataSeries*). Each series corresponds to one data column that holds Y data.
A cartesian chart is either a CategoryChart or a ScatterPlot.
In a CategoryChart, the X series represent different categories, which are listed consecutively in model row order. The X axis scale is set to CategoryScale.
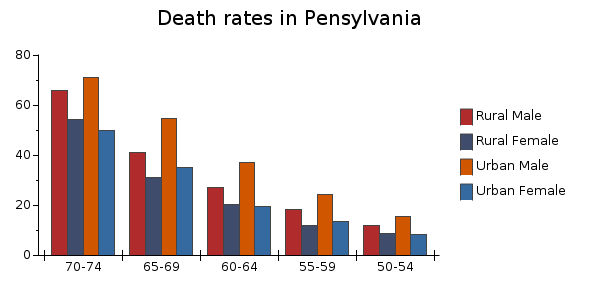
Each series may be rendered differently, and this is configured in the data series (see WDataSeries for more information).
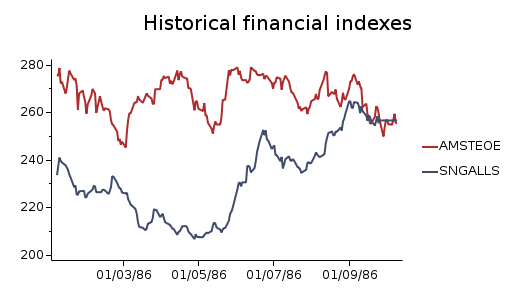
In a ScatterPlot, the X series data are interpreted as numbers on a numerical scale. The scale for the X axis defaults to a LinearScale, but this may be changed to a DateScale when the X series contains dates (of type WDate) to create a time series chart, or to a LogScale. A ScatterPlot supports the same types of data series as a CategoryChart, but does not support stacking. In a scatter plot, the X series do not need to be ordered in increasing values, and may be set differently for each dataseries using WDataSeries::setXSeriesColumn(int modelColumn).
Missing data in a model series Y values is interpreted as a break. For curve-like series, this breaks the curve (or line).
The cartesian chart has support for dual Y axes. Each data series may be bound to one of the two Y axes. By default, only the first Y axis is displayed. To show the second Y axis you will need to call:
By default a chart has a horizontal X axis and a vertical Y axis, which corresponds to a Vertical orientation. The orientation may be changed to Horizontal using setOrientation().
The styling of the series data are dictated by a palette which may be set using setPalette(WChartPalette *), but may be overridden by settings in each data series.
CSS
Styling through CSS is not applicable.
- See also
- WDataSeries, WAxis
- WPieChart
Constructor & Destructor Documentation
◆ WCartesianChart() [1/2]
| Wt::Chart::WCartesianChart::WCartesianChart | ( | WContainerWidget * | parent = 0 | ) |
Creates a new cartesian chart.
Creates a cartesian chart of type CategoryChart.
◆ WCartesianChart() [2/2]
| Wt::Chart::WCartesianChart::WCartesianChart | ( | ChartType | type, |
| WContainerWidget * | parent = 0 |
||
| ) |
Creates a new cartesian chart.
Creates a cartesian chart of the indicated type.
Member Function Documentation
◆ addCurveLabel()
| void Wt::Chart::WCartesianChart::addCurveLabel | ( | const CurveLabel & | label | ) |
Add a curve label.
- See also
- CurveLabel::CurveLabel()
◆ addDataPointArea()
|
virtual |
Adds a data point area (used for displaying e.g. tooltips).
You may want to specialize this is if you wish to modify (or delete) the area.
- Note
- Currently, an area is only created if the Wt::ToolTipRole data at the data point is not empty.
◆ addSeries() [1/2]
| void Wt::Chart::WCartesianChart::addSeries | ( | const WDataSeries & | series | ) |
Adds a data series.
A single chart may display one or more data series. Each data series displays data from a single model column in the chart. Series are plotted in the order that they have been added to the chart.
The series column is reset to -1 when the model is set (or changed). Thus you need to set a model before configuring the series.
- See also
- removeSeries(), setSeries()
- Deprecated:
- Use addSeries(WDataSeries *) instead
◆ addSeries() [2/2]
| void Wt::Chart::WCartesianChart::addSeries | ( | WDataSeries * | series | ) |
Adds a data series.
A single chart may display one or more data series. Each data series displays data from a single model column in the chart. Series are plotted in the order that they have been added to the chart.
The series column is reset to -1 when the model is set (or changed). Thus you need to set a model before configuring the series.
The chart will take ownership of the given series.
- See also
- removeSeries(), setSeries()
◆ addXAxis()
| int Wt::Chart::WCartesianChart::addXAxis | ( | WAxis * | waxis | ) |
Adds a X axis to this chart.
The first extra axis will have index 1, the next index 2,...
Returns the index of the added axis.
- Note
- This transfers ownership of the given WAxis to this chart.
- Precondition: waxis is not null
◆ addYAxis()
| int Wt::Chart::WCartesianChart::addYAxis | ( | WAxis * | waxis | ) |
Adds a Y axis to this chart.
The first extra axis will have index 2, the next index 3,...
Returns the index of the added axis.
- Note
- This transfers ownership of the given WAxis to this chart.
- Precondition: waxis is not null
◆ axis() [1/2]
Returns a chart axis.
Returns a reference to the specified axis.
◆ axis() [2/2]
Accesses a chart axis.
Returns a const reference to the specified axis.
◆ axisPadding()
| int Wt::Chart::WCartesianChart::axisPadding | ( | ) | const |
Returns the padding between the chart area and the axes.
This number may not reflect the actual padding of the individual axes, if another padding has been applied on the individual axes.
- See also
- setAxisPadding()
◆ barMargin()
| double Wt::Chart::WCartesianChart::barMargin | ( | ) | const |
Returns the margin between bars of different series.
- See also
- setBarMargin(double)
◆ borderPen()
| const WPen& Wt::Chart::WCartesianChart::borderPen | ( | ) | const |
Returns the pen used to draw the border around the chart area.
Defaults to NoPen.
- See also
- setBorderPen()
◆ calcChartArea()
|
protectedvirtual |
Calculates the chart area.
This calculates the chartArea(), which is the rectangle (in chart coordinates) that bounds the actual chart (thus excluding axes, labels, titles, legend, etc...).
- See also
- plotAreaPadding()
◆ chartSegmentArea() [1/2]
|
protected |
Returns the segment area for a combination of X and Y segments.
This segment area is used for clipping when rendering in a particular segment.
◆ chartSegmentArea() [2/2]
|
protected |
Returns the segment area for a combination of X and Y segments.
This segment area is used for clipping when rendering in a particular segment.
◆ clearCurveLabels()
| void Wt::Chart::WCartesianChart::clearCurveLabels | ( | ) |
Clear all curve labels.
- See also
- addCurveLabel()
◆ clearXAxes()
| void Wt::Chart::WCartesianChart::clearXAxes | ( | ) |
Clears all X axes.
The effect is the same as repeatedly using removeYAxis() until are axes are removed, i.e. any WDataSeries will also be removed.
◆ clearYAxes()
| void Wt::Chart::WCartesianChart::clearYAxes | ( | ) |
Clears all Y axes.
The effect is the same as repeatedly using removeYAxis() until are axes are removed, i.e. any WDataSeries will also be removed.
◆ createLegendItemWidget()
| WWidget * Wt::Chart::WCartesianChart::createLegendItemWidget | ( | int | index | ) |
Creates a widget which renders the a legend item.
The legend item widget will contain a text and a WPaintedWidget which draws the series' symbol.
◆ crosshairColor()
| const WColor& Wt::Chart::WCartesianChart::crosshairColor | ( | ) | const |
Returns the crosshair color.
- See also
- setCrosshairEnabled(), setCrosshairColor()
◆ crosshairEnabled()
| bool Wt::Chart::WCartesianChart::crosshairEnabled | ( | ) | const |
Returns whether the crosshair is enabled.
- See also
- setCrosshairEnabled()
◆ curveLabels()
| const std::vector<CurveLabel>& Wt::Chart::WCartesianChart::curveLabels | ( | ) | const |
Get all of the registered curve labels.
- See also
- setCurveLabels()
◆ curveManipulationEnabled()
| bool Wt::Chart::WCartesianChart::curveManipulationEnabled | ( | ) | const |
Returns whether curve manipulation is enabled.
- See also
- setCurveManipulationEnabled()
◆ disableFollowCurve()
| void Wt::Chart::WCartesianChart::disableFollowCurve | ( | ) |
Disable the follow curve functionality.
- See also
- setFollowCurve()
◆ drawMarker()
|
virtual |
Draws the marker for a given data series.
Draws the marker for the indicated series in the result. This method is called while painting the chart, and you may want to reimplement this method if you wish to provide a custom marker for a particular data series.
- See also
- setLegendEnabled()
◆ followCurve()
| const WDataSeries * Wt::Chart::WCartesianChart::followCurve | ( | ) | const |
Returns the curve that is to be followed.
If follow curve functionality is not enabled, returns -1.
- See also
- setFollowCurve()
◆ hv() [1/3]
|
protected |
Conversion between chart and painter coordinates.
Converts from chart coordinates to painter coordinates, taking into account the chart orientation.
◆ hv() [2/3]
Conversion between chart and painter coordinates.
Converts from chart coordinates to painter coordinates, taking into account the chart orientation.
◆ hv() [3/3]
Conversion between chart and painter coordinates.
Converts from chart coordinates to painter coordinates, taking into account the chart orientation.
◆ initLayout()
| bool Wt::Chart::WCartesianChart::initLayout | ( | const WRectF & | rectangle = WRectF(), |
| WPaintDevice * | device = 0 |
||
| ) | const |
Initializes the chart layout.
The mapping between model and device coordinates is only established after a rendering phase, or after calling initLayout manually.
You need a layout in order to use the mapFromDevice() and mapToDevice() methods.
Unless a specific chart rectangle is specified, the entire widget area is assumed.
◆ isInteractive()
| bool Wt::Chart::WCartesianChart::isInteractive | ( | ) | const |
Returns whether this chart is interactive.
Return true iff one of the interactive features is enabled, and the chart is being rendered on an HTML canvas.
◆ isLegendEnabled()
| bool Wt::Chart::WCartesianChart::isLegendEnabled | ( | ) | const |
Returns whether the legend is enabled.
- See also
- setLegendEnabled()
◆ legendAlignment()
| AlignmentFlag Wt::Chart::WCartesianChart::legendAlignment | ( | ) | const |
Returns the legend alignment.
- See also
- setLegendLocation()
◆ legendBackground()
| WBrush Wt::Chart::WCartesianChart::legendBackground | ( | ) | const |
Returns the legend background brush.
- See also
- setLegendStyle()
◆ legendBorder()
| WPen Wt::Chart::WCartesianChart::legendBorder | ( | ) | const |
Returns the legend border pen.
- See also
- setLegendStyle()
◆ legendColumns()
| int Wt::Chart::WCartesianChart::legendColumns | ( | ) | const |
Returns the legend columns.
- See also
- setLegendColumns()
◆ legendColumnWidth()
| WLength Wt::Chart::WCartesianChart::legendColumnWidth | ( | ) | const |
Returns the legend column width.
- See also
- setLegendColumns()
◆ legendFont()
| WFont Wt::Chart::WCartesianChart::legendFont | ( | ) | const |
Returns the legend font.
- See also
- setLegendStyle()
◆ legendLocation()
| LegendLocation Wt::Chart::WCartesianChart::legendLocation | ( | ) | const |
Returns the legend location.
- See also
- setLegendLocation()
◆ legendSide()
| Side Wt::Chart::WCartesianChart::legendSide | ( | ) | const |
Returns the legend side.
- See also
- setLegendLocation()
◆ loadingBackground()
| const WBrush& Wt::Chart::WCartesianChart::loadingBackground | ( | ) | const |
Returns the background brush for the unloaded area.
◆ map() [1/3]
|
protectedvirtual |
Map (x, y) value pair to chart coordinates coordinates.
The result needs further transformation using hv() to painter coordinates.
The default implementation is:
- See also
- map(double, double, const WAxis &, const WAxis &, int, int)
◆ map() [2/3]
|
protectedvirtual |
Map (x, y) value pair to chart coordinates coordinates.
The result needs further transformation using hv() to painter coordinates.
The default implementation is:
- See also
- map(double, double, const WAxis &, const WAxis &, int, int)
◆ map() [3/3]
|
protectedvirtual |
Map (x, y) value pair to chart coordinates coordinates.
The result needs further transformation using hv() to painter coordinates.
◆ mapFromDevice() [1/3]
| WPointF Wt::Chart::WCartesianChart::mapFromDevice | ( | const WPointF & | point, |
| Axis | ordinateAxis = OrdinateAxis |
||
| ) | const |
Maps from device coordinates to model coordinates.
Maps a position in the chart back to model coordinates.
This uses the axis dimensions that are based on the latest chart rendering. If you have not yet rendered the chart, or wish that the mapping already reflects model changes since the last rendering, you should call initLayout() first.
If the chart is interactive, mapFromDevice will correctly take the current zoom range into account.
- See also
- mapToDevice()
◆ mapFromDevice() [2/3]
Maps from device coordinates to model coordinates.
Maps a position in the chart back to model coordinates.
This uses the axis dimensions that are based on the latest chart rendering. If you have not yet rendered the chart, or wish that the mapping already reflects model changes since the last rendering, you should call initLayout() first.
If the chart is interactive, mapFromDevice will correctly take the current zoom range into account.
- See also
- mapToDevice()
◆ mapFromDevice() [3/3]
| WPointF Wt::Chart::WCartesianChart::mapFromDevice | ( | const WPointF & | point, |
| const WAxis & | xAxis, | ||
| const WAxis & | yAxis | ||
| ) | const |
Maps from device coordinates to model coordinates.
Maps a position in the chart back to model coordinates.
This uses the axis dimensions that are based on the latest chart rendering. If you have not yet rendered the chart, or wish that the mapping already reflects model changes since the last rendering, you should call initLayout() first.
If the chart is interactive, mapFromDevice will correctly take the current zoom range into account.
- See also
- mapToDevice()
◆ mapFromDeviceWithoutTransform() [1/3]
| WPointF Wt::Chart::WCartesianChart::mapFromDeviceWithoutTransform | ( | const WPointF & | point, |
| Axis | ordinateAxis = OrdinateAxis |
||
| ) | const |
Maps from device coordinates to model coordinates, ignoring the current zoom range.
Maps a position in the chart back to model coordinates, as if the chart was not zoomed in (nor panned).
This uses the axis dimensions that are based on the latest chart rendering. If you have not yet rendered the chart, or wish that the mapping already reflects model changes since the last rendering, you should call initLayout() first.
This function will not take the current zoom range into account. The mapping will be performed as if zoomRangeTransform() is the identity transform.
- See also
- mapToDeviceWithoutTransform()
◆ mapFromDeviceWithoutTransform() [2/3]
| WPointF Wt::Chart::WCartesianChart::mapFromDeviceWithoutTransform | ( | const WPointF & | point, |
| int | ordinateAxis | ||
| ) | const |
Maps from device coordinates to model coordinates, ignoring the current zoom range.
Maps a position in the chart back to model coordinates, as if the chart was not zoomed in (nor panned).
This uses the axis dimensions that are based on the latest chart rendering. If you have not yet rendered the chart, or wish that the mapping already reflects model changes since the last rendering, you should call initLayout() first.
This function will not take the current zoom range into account. The mapping will be performed as if zoomRangeTransform() is the identity transform.
- See also
- mapToDeviceWithoutTransform()
◆ mapFromDeviceWithoutTransform() [3/3]
| WPointF Wt::Chart::WCartesianChart::mapFromDeviceWithoutTransform | ( | const WPointF & | point, |
| const WAxis & | xAxis, | ||
| const WAxis & | yAxis | ||
| ) | const |
Maps from device coordinates to model coordinates, ignoring the current zoom range.
Maps a position in the chart back to model coordinates, as if the chart was not zoomed in (nor panned).
This uses the axis dimensions that are based on the latest chart rendering. If you have not yet rendered the chart, or wish that the mapping already reflects model changes since the last rendering, you should call initLayout() first.
This function will not take the current zoom range into account. The mapping will be performed as if zoomRangeTransform() is the identity transform.
- See also
- mapToDeviceWithoutTransform()
◆ mapToDevice() [1/3]
| WPointF Wt::Chart::WCartesianChart::mapToDevice | ( | const boost::any & | xValue, |
| const boost::any & | yValue, | ||
| Axis | axis = OrdinateAxis, |
||
| int | xSegment = 0, |
||
| int | ySegment = 0 |
||
| ) | const |
Maps model values onto chart coordinates.
This returns the chart device coordinates for a (x,y) pair of model values.
This uses the axis dimensions that are based on the latest chart rendering. If you have not yet rendered the chart, or wish that the mapping already reflects model changes since the last rendering, you should call initLayout() first.
The xSegment and ySegment arguments are relevant only when the corresponding axis is broken using WAxis::setBreak(). Then, its possible values may be 0 (below the break) or 1 (above the break).
If the chart is interactive, mapToDevice will correctly take the current zoom range into account.
- See also
- mapFromDevice()
◆ mapToDevice() [2/3]
| WPointF Wt::Chart::WCartesianChart::mapToDevice | ( | const boost::any & | xValue, |
| const boost::any & | yValue, | ||
| int | yAxis, | ||
| int | xSegment = 0, |
||
| int | ySegment = 0 |
||
| ) | const |
Maps model values onto chart coordinates.
This returns the chart device coordinates for a (x,y) pair of model values.
This uses the axis dimensions that are based on the latest chart rendering. If you have not yet rendered the chart, or wish that the mapping already reflects model changes since the last rendering, you should call initLayout() first.
The xSegment and ySegment arguments are relevant only when the corresponding axis is broken using WAxis::setBreak(). Then, its possible values may be 0 (below the break) or 1 (above the break).
If the chart is interactive, mapToDevice will correctly take the current zoom range into account.
- See also
- mapFromDevice()
◆ mapToDevice() [3/3]
| WPointF Wt::Chart::WCartesianChart::mapToDevice | ( | const boost::any & | xValue, |
| const boost::any & | yValue, | ||
| const WAxis & | xAxis, | ||
| const WAxis & | yAxis, | ||
| int | xSegment = 0, |
||
| int | ySegment = 0 |
||
| ) | const |
Maps model values onto chart coordinates.
This returns the chart device coordinates for a (x,y) pair of model values.
This uses the axis dimensions that are based on the latest chart rendering. If you have not yet rendered the chart, or wish that the mapping already reflects model changes since the last rendering, you should call initLayout() first.
The xSegment and ySegment arguments are relevant only when the corresponding axis is broken using WAxis::setBreak(). Then, its possible values may be 0 (below the break) or 1 (above the break).
If the chart is interactive, mapToDevice will correctly take the current zoom range into account.
- See also
- mapFromDevice()
◆ mapToDeviceWithoutTransform() [1/3]
| WPointF Wt::Chart::WCartesianChart::mapToDeviceWithoutTransform | ( | const boost::any & | xValue, |
| const boost::any & | yValue, | ||
| Axis | axis = OrdinateAxis, |
||
| int | xSegment = 0, |
||
| int | ySegment = 0 |
||
| ) | const |
Maps model values onto chart coordinates, ignoring the current zoom range.
This returns the chart device coordinates for a (x,y) pair of model values.
This uses the axis dimensions that are based on the latest chart rendering. If you have not yet rendered the chart, or wish that the mapping already reflects model changes since the last rendering, you should call initLayout() first.
The xSegment and ySegment arguments are relevant only when the corresponding axis is broken using WAxis::setBreak(). Then, its possible values may be 0 (below the break) or 1 (above the break).
This function will not take the current zoom range into account.The mapping will be performed as if zoomRangeTransform() is the identity transform.
- See also
- mapFromDeviceWithoutTransform()
◆ mapToDeviceWithoutTransform() [2/3]
| WPointF Wt::Chart::WCartesianChart::mapToDeviceWithoutTransform | ( | const boost::any & | xValue, |
| const boost::any & | yValue, | ||
| int | yAxis, | ||
| int | xSegment = 0, |
||
| int | ySegment = 0 |
||
| ) | const |
Maps model values onto chart coordinates, ignoring the current zoom range.
This returns the chart device coordinates for a (x,y) pair of model values.
This uses the axis dimensions that are based on the latest chart rendering. If you have not yet rendered the chart, or wish that the mapping already reflects model changes since the last rendering, you should call initLayout() first.
The xSegment and ySegment arguments are relevant only when the corresponding axis is broken using WAxis::setBreak(). Then, its possible values may be 0 (below the break) or 1 (above the break).
This function will not take the current zoom range into account.The mapping will be performed as if zoomRangeTransform() is the identity transform.
- See also
- mapFromDeviceWithoutTransform()
◆ mapToDeviceWithoutTransform() [3/3]
| WPointF Wt::Chart::WCartesianChart::mapToDeviceWithoutTransform | ( | const boost::any & | xValue, |
| const boost::any & | yValue, | ||
| const WAxis & | xAxis, | ||
| const WAxis & | yAxis, | ||
| int | xSegment = 0, |
||
| int | ySegment = 0 |
||
| ) | const |
Maps model values onto chart coordinates, ignoring the current zoom range.
This returns the chart device coordinates for a (x,y) pair of model values.
This uses the axis dimensions that are based on the latest chart rendering. If you have not yet rendered the chart, or wish that the mapping already reflects model changes since the last rendering, you should call initLayout() first.
The xSegment and ySegment arguments are relevant only when the corresponding axis is broken using WAxis::setBreak(). Then, its possible values may be 0 (below the break) or 1 (above the break).
This function will not take the current zoom range into account.The mapping will be performed as if zoomRangeTransform() is the identity transform.
- See also
- mapFromDeviceWithoutTransform()
◆ onDemandLoadingEnabled()
| bool Wt::Chart::WCartesianChart::onDemandLoadingEnabled | ( | ) | const |
Returns whether on-demand loading is enabled.
- See also
- setOnDemandLoadingEnabled()
◆ orientation()
| Orientation Wt::Chart::WCartesianChart::orientation | ( | ) | const |
Returns the chart orientation.
- See also
- setOrientation()
◆ paint()
|
overridevirtual |
Paint the chart in a rectangle of the given painter.
Paints the chart inside the painter, in the area indicated by rectangle. When rectangle is a null rectangle, the entire painter window is used.
Implements Wt::Chart::WAbstractChart.
◆ paintEvent()
|
overrideprotectedvirtual |
◆ panEnabled()
| bool Wt::Chart::WCartesianChart::panEnabled | ( | ) | const |
Returns whether pan is enabled.
- See also
- setPanEnabled()
◆ prepareAxes()
|
protectedvirtual |
Prepares the axes for rendering.
Computes axis properties such as the range (if not manually specified), label interval (if not manually specified) and axis locations. These properties are stored within the axes.
- See also
- initLayout()
◆ removeSeries() [1/2]
| void Wt::Chart::WCartesianChart::removeSeries | ( | int | modelColumn | ) |
Removes a data series.
This removes the first data series which plots the given modelColumn.
- See also
- addSeries(), setSeries()
- Deprecated:
- Use removeSeries(WDataSeries *) instead
◆ removeSeries() [2/2]
| void Wt::Chart::WCartesianChart::removeSeries | ( | WDataSeries * | series | ) |
Removes a data series.
The series will be deleted.
This will disassociate the given series from any WAxisSliderWidgets.
- See also
- addSeries(), setSeries()
◆ removeXAxis()
| void Wt::Chart::WCartesianChart::removeXAxis | ( | int | xAxisId | ) |
Removes the X axis with the given id.
The indices of the axes with an id higher than xAxisId will be decremented.
Any WDataSeries associated with the removed axis are also removed.
- Note
- Precondition: 0 <= xAxisId < xAxisCount()
◆ removeYAxis()
| void Wt::Chart::WCartesianChart::removeYAxis | ( | int | yAxisId | ) |
Removes the Y axis with the given id.
The indices of the axes with an id higher than yAxisId will be decremented.
Any WDataSeries associated with the removed axis are also removed.
- Note
- Precondition: 0 <= yAxisId < yAxisCount()
◆ render() [1/2]
|
protectedvirtual |
Renders the chart.
Renders the chart within the given rectangle. To accomodate both rendering of horizontal and vertically oriented charts, all rendering logic assumes horizontal. This "chart coordinates" space is transformed to painter coordinates using hv().
The default implementation looks like:
◆ render() [2/2]
|
overrideprotectedvirtual |
Renders the widget.
This function renders the widget (or an update for the widget), after this has been scheduled using scheduleRender().
The default implementation will render the widget by serializing changes to JavaScript and HTML. You may want to reimplement this widget if you have been postponing some of the layout / rendering implementation until the latest moment possible. In that case you should make sure you call the base implementation however.
Reimplemented from Wt::WPaintedWidget.
◆ renderAxes()
|
protectedvirtual |
◆ renderAxis()
|
protectedvirtual |
Renders properties of one axis.
- See also
- renderAxes()
◆ renderBackground()
|
protectedvirtual |
Renders the background.
- See also
- render()
◆ renderBorder()
|
protectedvirtual |
Renders the border of the chart area.
- See also
- render()
- setBorderPen()
◆ renderCurveLabels()
|
protectedvirtual |
Renders the curve labels.
- See also
- render()
- addCurveLabel()
◆ renderGrid()
|
protectedvirtual |
Renders grid lines along the ticks of the given axis.
- See also
- render()
◆ renderLabel()
|
protectedvirtual |
Utility function for rendering text.
This method renders text on the chart position pos, with a particular alignment flags. These are both specified in chart coordinates. The position is converted to painter coordinates using hv(), and the alignment flags are changed accordingly. The rotation, indicated by angle is specified in painter coordinates and thus an angle of 0 always indicates horizontal text, regardless of the chart orientation.
◆ renderLegend()
|
protectedvirtual |
Renders the (default) legend and chart titles.
- See also
- render()
◆ renderLegendIcon()
|
virtual |
Renders the legend icon for a given data series.
Renders the legend icon for the indicated series in the painter at position pos.
This method is called while rendering a legend item, and you may want to reimplement this method if you wish to provide a custom legend icon for a particular data series.
- See also
- renderLegendItem()
◆ renderLegendItem()
|
virtual |
Renders the legend item for a given data series.
Renders the legend item for the indicated series in the painter at position pos. The default implementation draws the marker, and the series description to the right. The series description is taken from the model's header data for that series' data column.
This method is called while painting the chart, and you may want to reimplement this method if you wish to provide a custom marker for a particular data series.
- See also
- setLegendEnabled()
◆ renderOther()
|
protectedvirtual |
Renders other, user-defined things.
The default implementation sets the painter's clip path to the chart area, but does not enable clipping.
This method can be overridden to draw extra content onto the chart.
Chart coordinates can be mapped to device coordinates with mapToDeviceWithoutTransform(). If these need to move and scale along with the zoom range, those points can be transformed with zoomRangeTransform().
This method is called last by default. If you want to render other things at some other moment, you can override render(WPainter&, const WRectF&).
◆ renderSeries()
|
protectedvirtual |
Renders all series data, including value labels.
- See also
- render()
◆ rubberBandEffectEnabled()
| bool Wt::Chart::WCartesianChart::rubberBandEffectEnabled | ( | ) | const |
Checks whether the rubberband effect is enabled.
- See also
- setRubberBandEffectEnabled()
◆ selectedSeries()
| const WDataSeries* Wt::Chart::WCartesianChart::selectedSeries | ( | ) | const |
Get the currently selected curve.
-1 means that no curve is currently selected.
- See also
- setSelectedSeries()
◆ series() [1/3]
| WDataSeries & Wt::Chart::WCartesianChart::series | ( | int | modelColumn | ) |
Returns a data series corresponding to a data column.
Returns a reference to the first data series that plots data from modelColumn.
◆ series() [2/3]
| const WDataSeries & Wt::Chart::WCartesianChart::series | ( | int | modelColumn | ) | const |
Returns a data series corresponding to a data column.
Returns a const reference to the first data series that plots data from modelColumn.
◆ series() [3/3]
| const std::vector<WDataSeries *>& Wt::Chart::WCartesianChart::series | ( | ) | const |
Returns a list with the current data series.
Returns the complete list of current data series.
◆ seriesSelected()
| Signal<const WDataSeries *, WPointF>& Wt::Chart::WCartesianChart::seriesSelected | ( | ) |
A signal that notifies the selection of a new curve.
This signal is emitted if a series is selected using a mouse click or long press. The first argument is the selected series. The second argument is the point that was selected, in model coordinates.
- See also
- setSeriesSelectionEnabled()
◆ seriesSelectionEnabled()
| bool Wt::Chart::WCartesianChart::seriesSelectionEnabled | ( | ) | const |
Returns whether series selection is enabled.
- See also
- setSeriesSelectionEnabled()
◆ setAxis()
Sets an axis.
Ownership is transferred and a previously set (default) axis is deleted first.
- See also
- axis(Axis axis)
◆ setAxisPadding()
| void Wt::Chart::WCartesianChart::setAxisPadding | ( | int | axisPadding | ) |
Sets the padding between the chart area and the axes.
This calls WAxes::setPadding() on all axes.
- See also
- axisPadding()
◆ setBarMargin()
| void Wt::Chart::WCartesianChart::setBarMargin | ( | double | margin | ) |
Sets the margin between bars of different series.
Use this method to change the margin that is set between bars of different series. The margin is specified as a fraction of the width. For example, a value of 0.1 adds a 10% margin between bars of each series. Negative values are also allowed. For example, use a margin of -1 to plot the bars of different series on top of each other.
The default value is 0.
◆ setBorderPen()
| void Wt::Chart::WCartesianChart::setBorderPen | ( | const WPen & | pen | ) |
Sets the pen of the border to be drawn around the chart area.
- See also
- borderPen()
◆ setCrosshairColor()
| void Wt::Chart::WCartesianChart::setCrosshairColor | ( | const WColor & | color | ) |
◆ setCrosshairEnabled()
| void Wt::Chart::WCartesianChart::setCrosshairEnabled | ( | bool | crosshair = true | ) |
Enables the crosshair functionality.
When enabled, the crosshair will follow mouse movement, and show in the top right corner the coordinate (according to X axis and the first Y axis) corresponding to this position.
When using touch, the crosshair can be moved with a drag. If both panning and the crosshair are enabled, the crosshair will be moved when dragging close to the crosshair. Otherwise, the chart will pan.
◆ setCrosshairXAxis()
| void Wt::Chart::WCartesianChart::setCrosshairXAxis | ( | int | xAxis | ) |
Sets the X axis to use for the crosshair.
Defaults to 0 (first X axis)
◆ setCrosshairYAxis()
| void Wt::Chart::WCartesianChart::setCrosshairYAxis | ( | int | yAxis | ) |
Sets the Y axis to use for the crosshair.
Defaults to 0 (first Y axis)
◆ setCurveLabels()
| void Wt::Chart::WCartesianChart::setCurveLabels | ( | const std::vector< CurveLabel > & | labels | ) |
Configure all curve labels at once.
- See also
- addCurveLabel()
◆ setCurveManipulationEnabled()
| void Wt::Chart::WCartesianChart::setCurveManipulationEnabled | ( | bool | enabled = true | ) |
Enable curve manipulation.
If curve manipulation is enabled, the scale and offset of the selected curve can be manipulated interactively using drag, scroll, and pinch.
- See also
- WDataSeries::setOffset()
- WDataSeries::setScale()
- WDataSeries::selectedSeries()
◆ setFollowCurve() [1/2]
| void Wt::Chart::WCartesianChart::setFollowCurve | ( | int | modelColumn | ) |
Enables the follow curve functionality for a data series.
This enables follow curve functionality for the data series corresponding to the given column.
If the data series is of type LineSeries or CurveSeries, the crosshair can only be moved in the x direction. The y position of the crosshair will be determined by the value of the data series. The crosshair will snap to the nearest point that is defined in the data series.
When using the mouse, the x position will change on mouseover. When using touch, the x position can be moved with a drag. The follow curve functionality has priority over the crosshair functionality.
Use column index -1 or disableFollowCurve() to disable the follow curve feature.
- Note
- The follow curve functionality requires that the X axis values of the data series are monotonically increasing or decreasing.
- Deprecated:
- Use setFollowCurve(const WDataSeries*) instead
◆ setFollowCurve() [2/2]
| void Wt::Chart::WCartesianChart::setFollowCurve | ( | const WDataSeries * | series | ) |
Enabled the follow curve funtionality for a data series.
This enables follow curve functionality for the data series corresponding to the given column.
If the data series is of type LineSeries or CurveSeries, the crosshair can only be moved in the x direction. The y position of the crosshair will be determined by the value of the data series. The crosshair will snap to the nearest point that is defined in the data series.
When using the mouse, the x position will change on mouseover. When using touch, the x position can be moved with a drag. The follow curve functionality has priority over the crosshair functionality.
Set to null to disable the follow curve feature.
- Note
- The follow curve functionality requires that the X axis values of the data series are monotonically increasing or decreasing.
◆ setLegendColumns()
| void Wt::Chart::WCartesianChart::setLegendColumns | ( | int | columns, |
| const WLength & | width | ||
| ) |
Configures multiple legend columns.
Multiple columns are typically useful when placing the legend at the top or at the bottom of the chart.
The default value is a single column, 100 pixels wide.
When automatic chart layout is enabled, then the legend column width is computed automatically, and this setting is ignored.
- See also
- setAutoLayoutEnabled()
◆ setLegendEnabled()
| void Wt::Chart::WCartesianChart::setLegendEnabled | ( | bool | enabled | ) |
Enables the legend.
The location of the legend can be configured using setLegendLocation(). Only series for which the legend is enabled are included in this legend.
The default value is false.
- See also
- see WDataSeries::isLegendEnabled(), setLegendLocation()
◆ setLegendLocation()
| void Wt::Chart::WCartesianChart::setLegendLocation | ( | LegendLocation | location, |
| Side | side, | ||
| AlignmentFlag | alignment | ||
| ) |
Configures the legend location.
The legend can be renderd either inside or outside of the chart area. When location is Chart::LegendInside, the legend will be rendered inside the chart. When location is Chart::Legendoutside, the legend is rendered outside the chart, in the chart padding area.
The provided side can either be Wt::Left, Wt::Right, Wt::Top, Wt::Bottom and configures the side of the chart at which the legend is displayed.
The alignment specifies how the legend is aligned. This can be a horizontal alignment flag (Wt::AlignLeft, Wt::AlignCenter, or Wt::AlignRight), when the side is Bottom or Top, or a vertical alignment flag (Wt::AlignTop, Wt::AlignMiddle, or Wt::AlignBottom) when the side is Left or Right.
The default location is Chart::LegendOutside, Wt::Right and Wt::AlignMiddle.
To have more control over the legend, you could reimplement the renderLegendItem() method to customize how one item in the legend is rendered, or, alternatively you can disable the legend generated by the chart itself, and reimplement the paint() method in which you use the renderLegendItem() method repeatedly to render a customized legend.
- See also
- WDataSeries::setLegendEnabled()
◆ setLegendStyle()
| void Wt::Chart::WCartesianChart::setLegendStyle | ( | const WFont & | font, |
| const WPen & | border, | ||
| const WBrush & | background | ||
| ) |
Configures the legend decoration.
This configures the font, border and background for the legend.
The default font is a 10pt sans serif font (the same as the default axis label font), the default border is NoPen and the default background is NoBrush.
- See also
- setLegendEnabled()
◆ setLoadingBackground()
| void Wt::Chart::WCartesianChart::setLoadingBackground | ( | const WBrush & | brush | ) |
Set the background brush for the unloaded area.
◆ setOnDemandLoadingEnabled()
| void Wt::Chart::WCartesianChart::setOnDemandLoadingEnabled | ( | bool | enabled | ) |
Enable on-demand loading.
By default, when on-demand loading is not enabled, the entire chart area is loaded, regardless of whether it is within the current zoom range of the X axis.
When on-demand loading is enabled only the currently visible area + some margin is loaded. As the visible area changes, different data is loaded. This improves performance for charts with a lot of data if not all of the data needs to be visible at the same time.
This feature is especially useful in combination with WAxis::setMaximumZoomRange() or WAxis::setMinZoom(), which makes it impossible for the user to view all of the data at the same time, because that would incur too much overhead.
- Note
- On-demand loading requires that the X axis data for all data series is sorted in ascending order. This feature is optimized for equidistant X axis data, but that's not a requirement.
- If no minimum or maximum are set on the Y axis (or axes), then the chart will still have to scan all data of its data series to automatically determine the minimum and maximum Y axis values. If this performance hit is undesirable and the Y axis range is known or guaranteed to be within a certain range, make sure to set a range on the Y axis (or axes).
- See also
- onDemandLoadingEnabled()
◆ setOrientation()
| void Wt::Chart::WCartesianChart::setOrientation | ( | Orientation | orientation | ) |
Sets the chart orientation.
Sets the chart orientation, which corresponds to the orientation of the Y axis: a Wt::Vertical orientation corresponds to the conventional way of a horizontal X axis and vertical Y axis. A Wt::Horizontal orientation is the other way around.
The default orientation is Wt::Vertical.
- See also
- orientation()
◆ setPanEnabled()
| void Wt::Chart::WCartesianChart::setPanEnabled | ( | bool | pan = true | ) |
Enables pan functionality.
When using the mouse, you can click and drag to pan the chart (if zoomed in), or use the scrollwheel.
When using touch, you can drag to pan the chart. If the rubberband effect is enabled, this is intertial (it will keep scrolling after you let go) and there is an overscroll and bounce back effect on the sides.
The default value is false.
- See also
- panEnabled()
◆ setRubberBandEffectEnabled()
| void Wt::Chart::WCartesianChart::setRubberBandEffectEnabled | ( | bool | rubberBand = true | ) |
Enables/disables the inertial scrolling and rubberband effect.
- See also
- setPanEnabled()
◆ setSelectedSeries()
| void Wt::Chart::WCartesianChart::setSelectedSeries | ( | const WDataSeries * | series | ) |
Sets the series that is currently selected.
The series with the given model column will be selected. The other series will be shown in a lighter color. The series that is currently selected is the one that can be manipulated if curve manipulation is enabled, and it is a LineSeries or CurveSeries.
The selected series can be changed using a long touch or mouse click.
If the argument provided is null or series selection is not enabled, no series will be selected.
◆ setSeries() [1/2]
| void Wt::Chart::WCartesianChart::setSeries | ( | const std::vector< WDataSeries > & | series | ) |
Sets all data series.
Replaces the current list of series with the new list.
- See also
- series(), addSeries(), removeSeries()
- Deprecated:
- Use setSeries(const std::vector<WDataSeries *> &series) instead
◆ setSeries() [2/2]
| void Wt::Chart::WCartesianChart::setSeries | ( | const std::vector< WDataSeries *> & | series | ) |
Sets all data series.
Replaces the current list of series with the new list. The chart takes ownership of all of the series.
- Note
- All series currently associated with the chart will be deleted. Hence, these series should be distinct from the currently associated series of this chart!
◆ setSeriesSelectionEnabled()
| void Wt::Chart::WCartesianChart::setSeriesSelectionEnabled | ( | bool | enabled = true | ) |
Sets whether series selection is enabled.
If series selection is enabled, series can be selected with a mouse click or long press. If the selected series is a LineSeries or CurveSeries, it can be manipulated if curve manipulation is enabled. The series that are not selected, will be shown in a lighter color.
◆ setSoftLabelClipping()
| void Wt::Chart::WCartesianChart::setSoftLabelClipping | ( | bool | enabled | ) |
Enables or disables soft label clipping on all axes.
- See also
- WAxis::setSoftLabelClipping()
◆ setTextPen()
| void Wt::Chart::WCartesianChart::setTextPen | ( | const WPen & | pen | ) |
set the pen used to render the labels
This method overwrites the pen for all axes
- See also
- WAxis::setTextPen()
◆ setType()
| void Wt::Chart::WCartesianChart::setType | ( | ChartType | type | ) |
Sets the chart type.
The chart type determines how (x,y) data are interpreted. In a CategoryChart, the X values are categories, and these are plotted consecutively, evenly spaced, and in row order. In a ScatterPlot, the X values are interpreted numerically (as for Y values).
The default chart type is a CategoryChart.
- See also
- type()
- WAxis::setScale(), axis(Axis)
◆ setWheelActions()
| void Wt::Chart::WCartesianChart::setWheelActions | ( | WheelActions | wheelActions | ) |
Sets the mapping of mouse wheel actions for interactive charts.
- See also
- wheelActions()
◆ setXSeriesColumn()
| void Wt::Chart::WCartesianChart::setXSeriesColumn | ( | int | modelColumn | ) |
Sets the the model column for the X series.
Use this method to specify the default data for the X series. For a ScatterPlot this is mandatory if an X series is not specified for every WDataSeries. For a CategoryChart, if not specified, an increasing series of integer numbers will be used (1, 2, ...).
Scatterplot dataseries may each individually be given its own X series data using WDataSeries::setXSeriesColumn(int modelColumn)
The default value is -1 (not specified).
The series column is reset to -1 when the model is set (or changed). Thus you need to set a model before configuring the series.
- See also
- XSeriesColumn()
◆ setZoomEnabled()
| void Wt::Chart::WCartesianChart::setZoomEnabled | ( | bool | zoom = true | ) |
Enables zoom functionality.
When using the mouse, press the ctrl key while scrolling to zoom in/out a specific point on the chart. If you press shift+ctrl, it will only zoom vertically. If you press alt+ctrl, it will only zoom horizontally. To change these default mappings, use setWheelActions().
When using touch, you can use a pinch gesture to zoom in/out. If the pinch gesture is vertical/horizontal, it will zoom only vertically/horizontally, otherwise it will zoom both axes equally.
The default value is false.
◆ type()
◆ wheelActions()
| WheelActions Wt::Chart::WCartesianChart::wheelActions | ( | ) | const |
Returns the current mouse wheel actions for interactive charts.
- See also
- setWheelActions()
◆ xAxes() [1/2]
| std::vector< WAxis * > Wt::Chart::WCartesianChart::xAxes | ( | ) |
Returns a vector of all X axes associated with this chart.
This defaults to a vector of one axis.
◆ xAxes() [2/2]
| std::vector< const WAxis * > Wt::Chart::WCartesianChart::xAxes | ( | ) | const |
Returns a vector of all X axes associated with this chart.
This defaults to a vector of one axis.
◆ xAxis() [1/2]
| WAxis & Wt::Chart::WCartesianChart::xAxis | ( | int | i | ) |
Retrieves the X axis at index i.
The following expression is always true:
- Note
- Precondition: 0 <= i < xAxisCount()
◆ xAxis() [2/2]
| const WAxis & Wt::Chart::WCartesianChart::xAxis | ( | int | i | ) | const |
Retrieves the X axis at index i.
The following expression is always true:
- Note
- Precondition: 0 <= i < xAxisCount()
◆ XSeriesColumn()
| int Wt::Chart::WCartesianChart::XSeriesColumn | ( | ) | const |
Returns the model column for the X series.
- See also
- setXSeriesColumn()
◆ yAxes() [1/2]
| std::vector< WAxis * > Wt::Chart::WCartesianChart::yAxes | ( | ) |
Returns a vector of all Y axes associated with this chart.
This defaults to a vector of two axes: the Y1 and Y2 axes. Y1 will be at index 0, and Y2 will be at index 1.
◆ yAxes() [2/2]
| std::vector< const WAxis * > Wt::Chart::WCartesianChart::yAxes | ( | ) | const |
Returns a vector of all Y axes associated with this chart.
This defaults to a vector of two axes: the Y1 and Y2 axes. Y1 will be at index 0, and Y2 will be at index 1.
◆ yAxis() [1/2]
| WAxis & Wt::Chart::WCartesianChart::yAxis | ( | int | i | ) |
Retrieves the Y axis at index i.
The following expressions are always true:
- Note
- Precondition: 0 <= i < yAxisCount()
◆ yAxis() [2/2]
| const WAxis & Wt::Chart::WCartesianChart::yAxis | ( | int | i | ) | const |
Retrieves the Y axis at index i.
The following expressions are always true:
- Note
- Precondition: 0 <= i < yAxisCount()
◆ zoomEnabled()
| bool Wt::Chart::WCartesianChart::zoomEnabled | ( | ) | const |
Returns whether zoom is enabled.
- See also
- setZoomEnabled()
◆ zoomRangeTransform() [1/2]
|
protected |
Returns the current zoom range transform.
This transform maps device coordinates from the fully zoomed out position to the current zoom range.
This transform is a JavaScript bound transform if this chart is interactive. Otherwise, this transform is just the identity transform.
◆ zoomRangeTransform() [2/2]
|
protected |
Returns the current zoom range transform.
This transform maps device coordinates from the fully zoomed out position to the current zoom range.
This transform is a JavaScript bound transform if this chart is interactive. Otherwise, this transform is just the identity transform.