|
Wt
4.0.0
|
A single data series in a cartesian chart. More...
#include <Wt/Chart/WDataSeries.h>
Public Member Functions | |
| WDataSeries (int modelColumn, SeriesType seriesType=SeriesType::Point, Axis axis=Axis::Y1) | |
| Constructs a new data series. More... | |
| void | setBarWidth (const double width) |
| Sets the bar width. More... | |
| double | barWidth () const |
| Returns the bar width. More... | |
| void | setType (SeriesType t) |
| Sets the series type. More... | |
| SeriesType | type () const |
| Returns the series type. More... | |
| void | setModelColumn (int modelColumn) |
| Sets the model column. More... | |
| int | modelColumn () const |
| Returns the model column. More... | |
| void | setXSeriesColumn (int modelColumn) |
| Sets the X series column. More... | |
| int | XSeriesColumn () const |
| Returns the X series column. More... | |
| void | setStacked (bool stacked) |
| Sets whether this series is stacked on top of the preceding series. More... | |
| bool | isStacked () const |
| Returns whether this series is stacked on top of the preceding series. More... | |
| void | bindToAxis (Axis axis) |
| Binds this series to a chart axis. More... | |
| Axis | axis () const |
| Returns the chart axis used for this series. More... | |
| void | setCustomFlags (WFlags< CustomFlag > customFlags) |
| Sets which aspects of the look are overriden. More... | |
| WFlags< CustomFlag > | customFlags () const |
| Returns which aspects of the look are overriden. More... | |
| void | setPen (const WPen &pen) |
| Overrides the pen used for drawing lines for this series. More... | |
| WPen | pen () const |
| Returns the pen used for drawing lines for this series. More... | |
| void | setBrush (const WBrush &brush) |
| Overrides the brush used for filling areas for this series. More... | |
| WBrush | brush () const |
| Returns the brush used for filling areas for this series. More... | |
| void | setShadow (const WShadow &shadow) |
| Sets a shadow used for stroking lines for this series. | |
| const WShadow & | shadow () const |
| Returns the shadow used for stroking lines for this series. More... | |
| void | setFillRange (FillRangeType fillRange) |
| Sets the fill range for line or curve series. More... | |
| FillRangeType | fillRange () const |
| Returns the fill range (for line, curve and bar series). More... | |
| void | setMarker (MarkerType marker) |
| Sets the data point marker. More... | |
| void | setCustomMarker (const WPainterPath &path) |
| Sets the custom marker. More... | |
| WPainterPath | customMarker () const |
| Returns the custom marker. More... | |
| MarkerType | marker () const |
| Returns the data point marker. More... | |
| void | setMarkerSize (double size) |
| Sets the marker size. More... | |
| double | markerSize () const |
| Returns the marker size. More... | |
| void | setMarkerPen (const WPen &pen) |
| Sets the marker pen. More... | |
| WPen | markerPen () const |
| Returns the marker pen. More... | |
| void | setMarkerBrush (const WBrush &brush) |
| Sets the marker brush. More... | |
| WBrush | markerBrush () const |
| Returns the marker brush. More... | |
| void | setLegendEnabled (bool enabled) |
| Enables the entry for this series in the legend. More... | |
| bool | isLegendEnabled () const |
| Returns whether this series has an entry in the legend. More... | |
| void | setLabelsEnabled (Axis axis, bool enabled=true) |
| Enables a label that is shown at the series data points. More... | |
| bool | isLabelsEnabled (Axis axis) const |
| Returns whether labels are enabled for the given axis. More... | |
| void | setLabelColor (const WColor &color) |
| Sets the label color. More... | |
| WColor | labelColor () const |
| Returns the label color. More... | |
| void | setHidden (bool hidden) |
| Hide/unhide this series. More... | |
| bool | isHidden () const |
| Return whether the series is hidden. More... | |
| WPointF | mapFromDevice (const WPointF &deviceCoordinates) const |
| Maps from device coordinates to model coordinates. More... | |
| WPointF | mapToDevice (const cpp17::any &xValue, const cpp17::any &yValue, int segment=0) const |
| Maps from model values to device coordinates. More... | |
| void | setOffset (double offset) |
| Set an offset to draw the data series at. More... | |
| double | offset () const |
| Method::Get the offset for this data series. More... | |
| void | setScale (double scale) |
| Set the scale to draw the data series at. More... | |
| double | scale () const |
| Method::Get the scale for this data series. More... | |
| void | setModel (const std::shared_ptr< WAbstractChartModel > &model) |
| Set a model for this data series. More... | |
| std::shared_ptr< WAbstractChartModel > | model () const |
| Method::Get the model for this data series. More... | |
A single data series in a cartesian chart.
This class configures all aspects for rendering a single data series in a cartesian chart. A data series renders Y data from a single model column against the X series configured for the chart.
The data column should contain data that can be converted to a number, but should not necessarily be of a number type, see also asNumber(const boost::any&).
Multiple series of different types may be combined on a single chart.
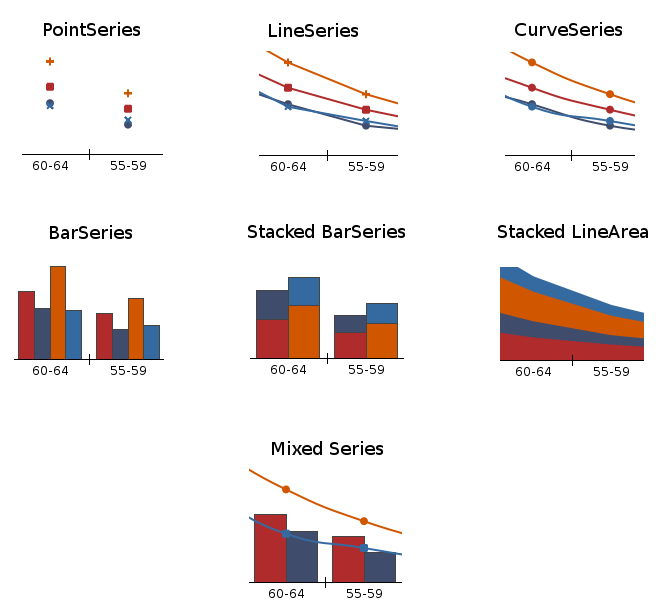
For a category chart, series may be stacked on top of each other. This is controlled by setStacked() for a series, which if enabled, will stack that series on top of the preceding data series. This works regardless of whether they are of the same type, but obviously works visually best if these series are of the same type. When not stacked, bar series are rendered next to each other. The margin between bars of different data series is controlled using WCartesianChart::setBarMargin().
The line and color type are by default based on the chart palette, but may be overridden for a series using setPen(), setBrush(), etc...
| Wt::Chart::WDataSeries::WDataSeries | ( | int | modelColumn, |
| SeriesType | seriesType = SeriesType::Point, |
||
| Axis | axis = Axis::Y1 |
||
| ) |
Constructs a new data series.
Creates a new data series which plots the Y values from the model column modelColumn, with the indicated seriesType. The Y values are mapped to the indicated axis, which should correspond to one of the two Y axes.
| Axis Wt::Chart::WDataSeries::axis | ( | ) | const |
Returns the chart axis used for this series.
| double Wt::Chart::WDataSeries::barWidth | ( | ) | const |
Returns the bar width.
| void Wt::Chart::WDataSeries::bindToAxis | ( | Axis | axis | ) |
Binds this series to a chart axis.
A data series may be bound to either the first or second Y axis. Note that the second Y axis is by default not displayed.
The default value is the first Y axis.
| WBrush Wt::Chart::WDataSeries::brush | ( | ) | const |
Returns the brush used for filling areas for this series.
| WFlags<CustomFlag> Wt::Chart::WDataSeries::customFlags | ( | ) | const |
Returns which aspects of the look are overriden.
| WPainterPath Wt::Chart::WDataSeries::customMarker | ( | ) | const |
Returns the custom marker.
| FillRangeType Wt::Chart::WDataSeries::fillRange | ( | ) | const |
Returns the fill range (for line, curve and bar series).
| bool Wt::Chart::WDataSeries::isHidden | ( | ) | const |
Return whether the series is hidden.
| bool Wt::Chart::WDataSeries::isLabelsEnabled | ( | Axis | axis | ) | const |
Returns whether labels are enabled for the given axis.
| bool Wt::Chart::WDataSeries::isLegendEnabled | ( | ) | const |
Returns whether this series has an entry in the legend.
| bool Wt::Chart::WDataSeries::isStacked | ( | ) | const |
Returns whether this series is stacked on top of the preceding series.
| WColor Wt::Chart::WDataSeries::labelColor | ( | ) | const |
Returns the label color.
Maps from device coordinates to model coordinates.
Maps a position in the chart back to model coordinates, for data in this data series.
This uses WChart::mapFromDevice() passing the axis() to which this series is bound.
This method uses the axis dimensions that are based on the latest chart rendering. If you have not yet rendered the chart, or wish to already the mapping reflect model changes since the last rendering, you should call WCartesianChart::initLayout() first.
| WPointF Wt::Chart::WDataSeries::mapToDevice | ( | const cpp17::any & | xValue, |
| const cpp17::any & | yValue, | ||
| int | segment = 0 |
||
| ) | const |
Maps from model values to device coordinates.
Maps model values to device coordinates, for data in this data series.
This uses WChart::mapToDevice() passing the axis() to which this series is bound.
This method uses the axis dimensions that are based on the latest chart rendering. If you have not yet rendered the chart, or wish to already the mapping reflect model changes since the last rendering, you should call WCartesianChart::initLayout() first.
| MarkerType Wt::Chart::WDataSeries::marker | ( | ) | const |
Returns the data point marker.
| WBrush Wt::Chart::WDataSeries::markerBrush | ( | ) | const |
Returns the marker brush.
| WPen Wt::Chart::WDataSeries::markerPen | ( | ) | const |
Returns the marker pen.
| double Wt::Chart::WDataSeries::markerSize | ( | ) | const |
Returns the marker size.
| std::shared_ptr< WAbstractChartModel > Wt::Chart::WDataSeries::model | ( | ) | const |
Method::Get the model for this data series.
This will return the model set for this data series, if it is set.
If no model is set for this data series, and the series is associated with a chart, the model of the chart is returned.
If no model is set for this data series, and the series is not associated with any data series, this will return null.
| int Wt::Chart::WDataSeries::modelColumn | ( | ) | const |
Returns the model column.
| double Wt::Chart::WDataSeries::offset | ( | ) | const |
Method::Get the offset for this data series.
| WPen Wt::Chart::WDataSeries::pen | ( | ) | const |
Returns the pen used for drawing lines for this series.
| double Wt::Chart::WDataSeries::scale | ( | ) | const |
Method::Get the scale for this data series.
| void Wt::Chart::WDataSeries::setBarWidth | ( | const double | width | ) |
Sets the bar width.
The bar width specifies the bar width (in axis dimensions). For category plots, which may have several bars for different series next to each other, you will want to specify the same bar width for each series.
For scatter plots, you may want to set the bar width to a natural size. E.g. if you are plotting weekly measurements, you could set the width to correspond to a week (=7).
The default value is 0.8 (which leaves a 20% margin between bars for different categories in a category chart.
| void Wt::Chart::WDataSeries::setBrush | ( | const WBrush & | brush | ) |
Overrides the brush used for filling areas for this series.
Overrides the brush that is used to draw this series which is otherwise provided by the chart palette. For a bar plot, this is the brush used to fill the bars. For a line chart, this is the brush used to fill the area under (or above) the line. Calling this method automatically adds CustomBrush to the custom flags.
| void Wt::Chart::WDataSeries::setCustomFlags | ( | WFlags< CustomFlag > | customFlags | ) |
Sets which aspects of the look are overriden.
Set which aspects of the look, that are by default based on the chart palette, are overridden by custom settings.
The default value is 0 (nothing overridden).
| void Wt::Chart::WDataSeries::setCustomMarker | ( | const WPainterPath & | path | ) |
Sets the custom marker.
This will also changes the marker type to MarkerType::Custom.
| void Wt::Chart::WDataSeries::setFillRange | ( | FillRangeType | fillRange | ) |
Sets the fill range for line or curve series.
AxisProperty::Line or curve series may be filled under or above the curve, using the brush(). This setting specifies the range that is filled. The default value for all but SeriesType::Bar is FillRangeType::None.
Bar series may use FillRangeType::MinimumValue to configure the chart to render its bars from the data point to the bottom of the chart or FillRangeType::MaximumValue to render the bars from the data point to the top of the chart. The default value for SeriesType::Bar is FillRangeType::ZeroValue, which render bars from zero to the data value.
| void Wt::Chart::WDataSeries::setHidden | ( | bool | hidden | ) |
Hide/unhide this series.
A hidden series will not be show in the chart and legend.
| void Wt::Chart::WDataSeries::setLabelColor | ( | const WColor & | color | ) |
Sets the label color.
Specify the color used for the rendering labels at the data points.
| void Wt::Chart::WDataSeries::setLabelsEnabled | ( | Axis | axis, |
| bool | enabled = true |
||
| ) |
Enables a label that is shown at the series data points.
You may enable labels for the Axis::X, Axis::Y or both axes. The label that is displayed is the corresponding value on that axis. If both labels are enabled then they are combined in a single text using the format: "<x-value>: <y-value>".
The default values are false for both axes (no labels).
| void Wt::Chart::WDataSeries::setLegendEnabled | ( | bool | enabled | ) |
Enables the entry for this series in the legend.
When enabled, this series is added to the chart legend.
The default value is true.
| void Wt::Chart::WDataSeries::setMarker | ( | MarkerType | marker | ) |
Sets the data point marker.
Specifies a marker that is displayed at the (X,Y) coordinate for each series data point.
The default value is a MarkerType::Circle for a SeriesType::Point, or MarkerType::None otherwise.
| void Wt::Chart::WDataSeries::setMarkerBrush | ( | const WBrush & | brush | ) |
Sets the marker brush.
Overrides the brush used for filling the marker. By default the marker brush is the same as brush(). Calling this method automatically adds CustomMarkerBrush to the custom flags.
| void Wt::Chart::WDataSeries::setMarkerPen | ( | const WPen & | pen | ) |
Sets the marker pen.
Overrides the pen used for stroking the marker. By default the marker pen is the same as pen(). Calling this method automatically adds CustomMarkerPen to the custom flags.
| void Wt::Chart::WDataSeries::setMarkerSize | ( | double | size | ) |
Sets the marker size.
The default marker size is 6 pixels.
| void Wt::Chart::WDataSeries::setModel | ( | const std::shared_ptr< WAbstractChartModel > & | model | ) |
Set a model for this data series.
If no model is set for this data series, the model of the chart will be used.
| void Wt::Chart::WDataSeries::setModelColumn | ( | int | modelColumn | ) |
Sets the model column.
This specifies the model column from which the Y data is retrieved that is plotted by this series.
The data column should contain data that can be converted to a number (but should not necessarily be of a number type).
| void Wt::Chart::WDataSeries::setOffset | ( | double | offset | ) |
Set an offset to draw the data series at.
The Y position of the data series will be drawn at an offset, expressed in model coordinates. The axis labels won't follow the same offset.
The offset can be manipulated client side using a mouse or touch drag if WCartesianChart::curveManipulationEnabled() is enabled.
| void Wt::Chart::WDataSeries::setPen | ( | const WPen & | pen | ) |
Overrides the pen used for drawing lines for this series.
Overrides the pen that is used to draw this series. Calling this method automatically adds CustomPen to the custom flags.
The default value is a default WPen().
| void Wt::Chart::WDataSeries::setScale | ( | double | scale | ) |
Set the scale to draw the data series at.
The Y position of the data series will be scaled around the zero position, and offset by offset().
The scale can be manipulated client side using the scroll wheel or a pinch motion if WCartesianChart::curveManipulationEnabled() is enabled.
| void Wt::Chart::WDataSeries::setStacked | ( | bool | stacked | ) |
Sets whether this series is stacked on top of the preceding series.
For category charts, data from different series may be rendered stacked on top of each other. The rendered value is the sum of the value of this series plus the rendered value of the preceding series. For line series, you probably will want to add filling under the curve. A stacked bar series is rendered by a bar on top of the preceding bar series.
The default value is false.
| void Wt::Chart::WDataSeries::setType | ( | SeriesType | t | ) |
Sets the series type.
The series type specifies how the data is plotted, i.e. using mere point markers, lines, curves, or bars.
| void Wt::Chart::WDataSeries::setXSeriesColumn | ( | int | modelColumn | ) |
Sets the X series column.
By default, the data series uses the X series column configured for the chart. For a scatter plot, each series can have its own matching X data, which is configured here. For other plots, this setting is ignored.
The default value is -1, which indicates that WCartesianChart::XSeriesColumn() is to be used.
| const WShadow & Wt::Chart::WDataSeries::shadow | ( | ) | const |
Returns the shadow used for stroking lines for this series.
| SeriesType Wt::Chart::WDataSeries::type | ( | ) | const |
Returns the series type.
| int Wt::Chart::WDataSeries::XSeriesColumn | ( | ) | const |
Returns the X series column.
 1.8.11

