Class WScatterData
General information can be found at WAbstractDataSeries3D. The model should be
structured as a table where every row represents a point. In the simplest case, there are three
columns representing the x-, y- and z-values. By default, this is column 0 for X, column 1 for Y
and column 2 for Z. It is also possible to provide an additional column containing information on
the color for each point. The same is possible for the size. Color-information in the model
should be present as a WColor.
If these extra columns are not included, the ItemDataRole.MarkerBrushColor and ItemDataRole.MarkerScaleFactor can still be used to style individual points. These dataroles
should be set on the values in the column containing the z-values.
The figure below shows an upward spiral of points, with droplines enabled and a pointsize of 5 pixels.
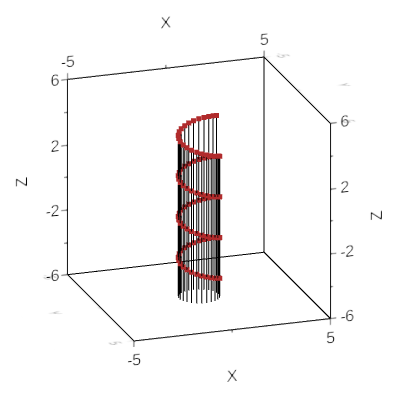
An example of WScatterData
-
Nested Class Summary
Nested classes/interfaces inherited from class eu.webtoolkit.jwt.WObject
WObject.FormData -
Field Summary
Fields inherited from class eu.webtoolkit.jwt.chart.WAbstractDataSeries3D
chart_, model_, pointSprite_ -
Constructor Summary
Constructors -
Method Summary
Modifier and TypeMethodDescriptionvoidDelete GL resources.Returns the pen that is used to draw droplines.voidInitialize GL resources.booleanReturns whether droplines are enabled.doubleReturns the computed maximum value of this dataseries along the given axis.doubleReturns the computed minimum value of this dataseries along the given axis.voidpaintGL()Update the client-side painting function.pickPoints(int x, int y, int radius) Pick points on thisWScatterDatausing a single pixel.pickPoints(int x1, int y1, int x2, int y2) Pick points on thisWScatterDatainside of a rectangle.voidresizeGL()Act on resize events.final voidsetColorColumn(int columnNumber) Configure a column in the model to be used for the color of the points.voidsetColorColumn(int columnNumber, ItemDataRole role) Configure a column in the model to be used for the color of the points.final voidEnables or disables droplines for all points.voidsetDroplinesEnabled(boolean enabled) Enables or disables droplines for all points.voidsetDroplinesPen(WPen pen) Sets the pen that is used to draw droplines.final voidsetSizeColumn(int columnNumber) Configure a column in the model to be used for the size of the points.voidsetSizeColumn(int columnNumber, ItemDataRole role) Configure a column in the model to be used for the size of the points.voidsetXSeriesColumn(int columnNumber) Sets the column-index from the model that is used for the x-coordinate of all points.voidsetYSeriesColumn(int columnNumber) Sets the column-index from the model that is used for the y-coordinate of all points.voidsetZSeriesColumn(int columnNumber) Sets the column-index from the model that is used for the z-coordinate of all points.voidupdateGL()Update GL resources.intReturns the column-index from the model that is used for the x-coordinate of all points.intReturns the column-index from the model that is used for the y-coordinate of all points.intReturns the column-index from the model that is used for the z-coordinate of all points.Methods inherited from class eu.webtoolkit.jwt.chart.WAbstractDataSeries3D
getChart, getChartpaletteColor, getColorMap, getColorMapSide, getModel, getPointSize, getPointSprite, getPointSpriteTexture, getTitle, isColorMapVisible, isHidden, isLegendEnabled, loadPointSpriteTexture, setChart, setColorMap, setColorMapSide, setColorMapVisible, setColorMapVisible, setDefaultTitle, setHidden, setHidden, setLegendEnabled, setLegendEnabled, setModel, setPointSize, setPointSprite, setTitleMethods inherited from class eu.webtoolkit.jwt.WObject
getId, getObjectName, remove, setFormData, setObjectName, tr
-
Constructor Details
-
WScatterData
Constructor.
-
-
Method Details
-
setDroplinesEnabled
public void setDroplinesEnabled(boolean enabled) Enables or disables droplines for all points.Enabling droplines will cause a line to be drawn from every point to the the ground-plane of the chart's plotcube. By default the droplines are disabled.
- See Also:
-
setDroplinesEnabled
public final void setDroplinesEnabled()Enables or disables droplines for all points. -
isDroplinesEnabled
public boolean isDroplinesEnabled()Returns whether droplines are enabled. -
setDroplinesPen
Sets the pen that is used to draw droplines.The default pen is a default constructed
WPen.Note: only the width and color of the pen are used.
- See Also:
-
getDroplinesPen
Returns the pen that is used to draw droplines. -
setXSeriesColumn
public void setXSeriesColumn(int columnNumber) Sets the column-index from the model that is used for the x-coordinate of all points.The default X column index is 0.
-
XSeriesColumn
public int XSeriesColumn()Returns the column-index from the model that is used for the x-coordinate of all points.- See Also:
-
setYSeriesColumn
public void setYSeriesColumn(int columnNumber) Sets the column-index from the model that is used for the y-coordinate of all points.The default X column index is 1.
-
YSeriesColumn
public int YSeriesColumn()Returns the column-index from the model that is used for the y-coordinate of all points.- See Also:
-
setZSeriesColumn
public void setZSeriesColumn(int columnNumber) Sets the column-index from the model that is used for the z-coordinate of all points.The default Z column index is 2.
Note that this column is also used to check for a
ItemDataRole.MarkerBrushColorand aItemDataRole.MarkerScaleFactoris no color-column or size-column are set. -
ZSeriesColumn
public int ZSeriesColumn()Returns the column-index from the model that is used for the z-coordinate of all points.- See Also:
-
setColorColumn
Configure a column in the model to be used for the color of the points.By default, the color-column is set to -1. This means there is no column which specifies color-values. Also, the basic mechanism of using the
ItemDataRole.MarkerBrushColor(if present) is then active. The Z-seriescolumn is checked for the presence of this Role.- See Also:
-
setColorColumn
public final void setColorColumn(int columnNumber) Configure a column in the model to be used for the color of the points. -
setSizeColumn
Configure a column in the model to be used for the size of the points.By default, the size-column is set to -1. This means there is no column which specifies size-values. Also, the basic mechanism of using the
ItemDataRole.MarkerScaleFactor(if present) is then active. The Z-seriescolumn is checked for the presence of this Role.- See Also:
-
setSizeColumn
public final void setSizeColumn(int columnNumber) Configure a column in the model to be used for the size of the points. -
pickPoints
Pick points on thisWScatterDatausing a single pixel.x,y are the screen coordinates of the pixel from the top left of the chart, and radius is the radius in pixels around that pixel. All points around the ray projected through the pixel within the given radius will be returned.
-
pickPoints
Pick points on thisWScatterDatainside of a rectangle.The screen coordinates (x1, y1) and (x2, y2) from the top left of the chart define a rectangle within which the points should be selected.
-
minimum
Description copied from class:WAbstractDataSeries3DReturns the computed minimum value of this dataseries along the given axis.- Specified by:
minimumin classWAbstractDataSeries3D- See Also:
-
maximum
Description copied from class:WAbstractDataSeries3DReturns the computed maximum value of this dataseries along the given axis.- Specified by:
maximumin classWAbstractDataSeries3D- See Also:
-
getGlObjects
- Overrides:
getGlObjectsin classWAbstractDataSeries3D
-
initializeGL
public void initializeGL()Description copied from class:WAbstractDataSeries3DInitialize GL resources.This function is called by
initializeGL()in the chart to which this dataseries was added.- Specified by:
initializeGLin classWAbstractDataSeries3D
-
paintGL
public void paintGL()Description copied from class:WAbstractDataSeries3DUpdate the client-side painting function.This function is called by
paintGL()in the chart to which this dataseries was added.- Specified by:
paintGLin classWAbstractDataSeries3D
-
updateGL
public void updateGL()Description copied from class:WAbstractDataSeries3DUpdate GL resources.This function is called by
updateGL()in the chart to which this dataseries was added. Before this function is called,deleteAllGLResources()is called.- Specified by:
updateGLin classWAbstractDataSeries3D- See Also:
-
resizeGL
public void resizeGL()Description copied from class:WAbstractDataSeries3DAct on resize events.This function is called by
resizeGL()in the chart to which this dataseries was added.- Specified by:
resizeGLin classWAbstractDataSeries3D
-
deleteAllGLResources
public void deleteAllGLResources()Description copied from class:WAbstractDataSeries3DDelete GL resources.This function is called by
updateGL()in the chart to which this dataseries was added.- Specified by:
deleteAllGLResourcesin classWAbstractDataSeries3D
-