Class WDataSeries
This class configures all aspects for rendering a single data series in a cartesian chart. A data series renders Y data from a single model column against the X series configured for the chart.
The data column should contain data that can be converted to a number, but should not
necessarily be of a number type, see also StringUtils.asNumber(Object).
Multiple series of different types may be combined on a single chart.
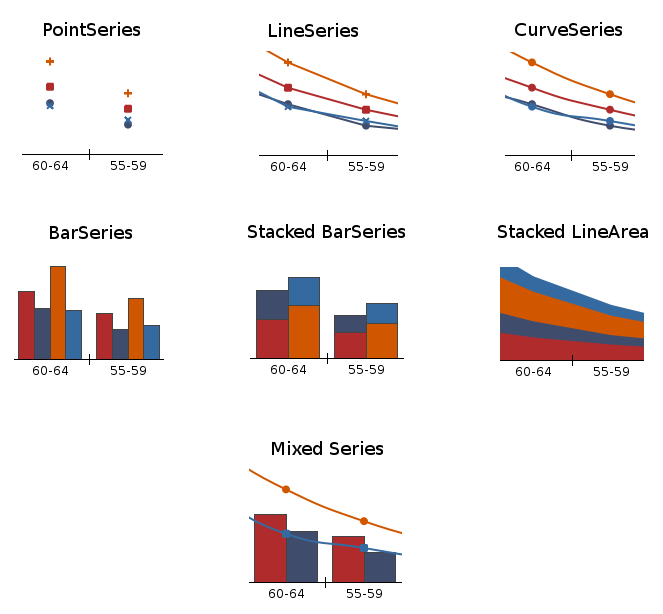
Different styles of data series
For a category chart, series may be stacked on top of each other. This is controlled by setStacked() for a series, which if enabled, will stack
that series on top of the preceding data series. This works regardless of whether they are of the
same type, but obviously works visually best if these series are of the same type. When not
stacked, bar series are rendered next to each other. The margin between bars of different data
series is controlled using WCartesianChart#setBarMargin().
The line and color type are by default based on the chart
palette, but may be overridden for a series using setPen(),
setBrush(), etc...
-
Nested Class Summary
Nested classes/interfaces inherited from class eu.webtoolkit.jwt.WObject
WObject.FormData -
Constructor Summary
ConstructorsConstructorDescriptionWDataSeries(int modelColumn) Constructs a new data series.WDataSeries(int modelColumn, SeriesType type) Constructs a new data series.WDataSeries(int modelColumn, SeriesType type, int axis) Constructs a new data series.WDataSeries(int modelColumn, SeriesType type, Axis axis) Constructs a new data series. -
Method Summary
Modifier and TypeMethodDescriptionvoidbindToAxis(Axis axis) Binds this series to a chart axis.voidbindToXAxis(int xAxis) Binds this series to a chart's X axis.voidbindToYAxis(int yAxis) Binds this series to a chart's Y axis.getAxis()Returns the Y axis used for this series.doubleReturns the bar width.getBrush()Returns the brush used for filling areas for this series.getChart()Returns which aspects of the look are overriden.Returns the custom marker.Returns the fill range (for line, curve and bar series).Returns the label color.Returns the data point marker.Returns the marker brush.Returns the marker pen.doubleReturns the marker size.getModel()Get the model for this data series.intReturns the model column.doubleGet the offset for this data series.getPen()Returns the pen used for drawing lines for this series.doublegetScale()Get the scale for this data series.Returns the shadow used for stroking lines for this series.getType()Returns the series type.intgetXAxis()Returns the Y axis used for this series.intgetYAxis()Returns the Y axis used for this series.booleanisHidden()Return whether the series is hidden.booleanisLabelsEnabled(Axis axis) Returns whether labels are enabled for the given axis.booleanReturns whether this series has an entry in the legend.booleanReturns whether this series is stacked on top of the preceding series.mapFromDevice(WPointF deviceCoordinates) Maps from device coordinates to model coordinates.final WPointFmapToDevice(Object xValue, Object yValue) Maps from model values to device coordinates.mapToDevice(Object xValue, Object yValue, int segment) Maps from model values to device coordinates.voidsetBarWidth(double width) Sets the bar width.voidOverrides the brush used for filling areas for this series.final voidsetCustomFlags(CustomFlag flag, CustomFlag... flags) Sets which aspects of the look are overriden.voidsetCustomFlags(EnumSet<CustomFlag> flags) Sets which aspects of the look are overriden.voidsetCustomMarker(WPainterPath path) Sets the custom marker.voidsetFillRange(FillRangeType fillRange) Sets the fill range for line or curve series.voidsetHidden(boolean hidden) Hide/unhide this series.voidsetLabelColor(WColor color) Sets the label color.final voidsetLabelsEnabled(Axis axis) Enables a label that is shown at the series data points.voidsetLabelsEnabled(Axis axis, boolean enabled) Enables a label that is shown at the series data points.voidsetLegendEnabled(boolean enabled) Enables the entry for this series in the legend.voidsetMarker(MarkerType marker) Sets the data point marker.voidsetMarkerBrush(WBrush brush) Sets the marker brush.voidsetMarkerPen(WPen pen) Sets the marker pen.voidsetMarkerSize(double size) Sets the marker size.voidsetModel(WAbstractChartModel model) Set a model for this data series.voidsetModelColumn(int modelColumn) Sets the model column.voidsetOffset(double offset) Set an offset to draw the data series at.voidOverrides the pen used for drawing lines for this series.voidsetScale(double scale) Set the scale to draw the data series at.voidSets a shadow used for stroking lines for this series.voidsetStacked(boolean stacked) Sets whether this series is stacked on top of the preceding series.voidsetType(SeriesType type) Sets the series type.voidsetXSeriesColumn(int modelColumn) Sets the X series column.intReturns the X series column.Methods inherited from class eu.webtoolkit.jwt.WObject
getId, getObjectName, remove, setFormData, setObjectName, tr
-
Constructor Details
-
WDataSeries
Constructs a new data series.Creates a new data series which plots the Y values from the model column modelColumn, with the indicated seriesType. The Y values are mapped to the indicated axis, which should correspond to one of the two Y axes.
-
WDataSeries
public WDataSeries(int modelColumn) Constructs a new data series. -
WDataSeries
Constructs a new data series. -
WDataSeries
Constructs a new data series.Creates a new data series which plots the Y values from the model column modelColumn, with the indicated seriesType. The Y values are mapped to the indicated yAxis, which should correspond to one of the two Y axes.
-
-
Method Details
-
setBarWidth
public void setBarWidth(double width) Sets the bar width.The bar width specifies the bar width (in axis dimensions). For category plots, which may have several bars for different series next to each other, you will want to specify the same bar width for each series.
For scatter plots, you may want to set the bar width to a natural size. E.g. if you are plotting weekly measurements, you could set the width to correspond to a week (=7).
The default value is 0.8 (which leaves a 20% margin between bars for different categories in a category chart.
-
getBarWidth
public double getBarWidth()Returns the bar width.- See Also:
-
setType
Sets the series type.The series type specifies how the data is plotted, i.e. using mere point markers, lines, curves, or bars.
-
getType
Returns the series type.- See Also:
-
setModelColumn
public void setModelColumn(int modelColumn) Sets the model column.This specifies the model column from which the Y data is retrieved that is plotted by this series.
The data column should contain data that can be converted to a number (but should not necessarily be of a number type). See also
StringUtils.asNumber(Object). -
getModelColumn
public int getModelColumn()Returns the model column.- See Also:
-
setXSeriesColumn
public void setXSeriesColumn(int modelColumn) Sets the X series column.By default, the data series uses the X series column configured for the chart. For a scatter plot, each series can have its own matching X data, which is configured here. For other plots, this setting is ignored.
The default value is -1, which indicates that
WCartesianChart.XSeriesColumn()is to be used. -
XSeriesColumn
public int XSeriesColumn()Returns the X series column.- See Also:
-
setStacked
public void setStacked(boolean stacked) Sets whether this series is stacked on top of the preceding series.For category charts, data from different series may be rendered stacked on top of each other. The rendered value is the sum of the value of this series plus the rendered value of the preceding series. For line series, you probably will want to add filling under the curve. A stacked bar series is rendered by a bar on top of the preceding bar series.
The default value is false.
-
isStacked
public boolean isStacked()Returns whether this series is stacked on top of the preceding series.- See Also:
-
bindToAxis
Binds this series to a chart axis.A data series may be bound to either the first or second Y axis. Note that the second Y axis is by default not displayed.
The default value is the first Y axis.
- See Also:
-
bindToXAxis
public void bindToXAxis(int xAxis) Binds this series to a chart's X axis.Note that the second Y axis will not be displayed by default.
The default value is the first X axis.
- See Also:
-
bindToYAxis
public void bindToYAxis(int yAxis) Binds this series to a chart's Y axis.Note that the second Y axis will not be displayed by default.
The default value is the first Y axis.
- See Also:
-
getAxis
Returns the Y axis used for this series.- See Also:
-
getXAxis
public int getXAxis()Returns the Y axis used for this series.- See Also:
-
getYAxis
public int getYAxis()Returns the Y axis used for this series.- See Also:
-
setCustomFlags
Sets which aspects of the look are overriden.Set which aspects of the look, that are by default based on the chart palette, are overridden by custom settings.
The default value is 0 (nothing overridden).
-
setCustomFlags
Sets which aspects of the look are overriden. -
getCustomFlags
Returns which aspects of the look are overriden.- See Also:
-
setPen
Overrides the pen used for drawing lines for this series.Overrides the pen that is used to draw this series. Calling this method automatically adds CustomPen to the custom flags.
The default value is a default WPen().
-
getPen
Returns the pen used for drawing lines for this series.- See Also:
-
setBrush
Overrides the brush used for filling areas for this series.Overrides the brush that is used to draw this series which is otherwise provided by the chart palette. For a bar plot, this is the brush used to fill the bars. For a line chart, this is the brush used to fill the area under (or above) the line. Calling this method automatically adds CustomBrush to the custom flags.
- See Also:
-
getBrush
Returns the brush used for filling areas for this series.- See Also:
-
setShadow
Sets a shadow used for stroking lines for this series. -
getShadow
Returns the shadow used for stroking lines for this series.- See Also:
-
setFillRange
Sets the fill range for line or curve series.Line or curve series may be filled under or above the curve, using the
getBrush(). This setting specifies the range that is filled. The default value for all butSeriesType.BarisFillRangeType.None.Bar series may use
FillRangeType.MinimumValueto configure the chart to render its bars from the data point to the bottom of the chart orFillRangeType.MaximumValueto render the bars from the data point to the top of the chart. The default value forSeriesType.BarisFillRangeType.ZeroValue, which render bars from zero to the data value. -
getFillRange
Returns the fill range (for line, curve and bar series).- See Also:
-
setMarker
Sets the data point marker.Specifies a marker that is displayed at the (X,Y) coordinate for each series data point.
The default value is a
MarkerType.Circlefor aSeriesType.Point, orMarkerType.Noneotherwise. -
setCustomMarker
Sets the custom marker.This will also changes the marker type to
MarkerType.Custom.- See Also:
-
getCustomMarker
Returns the custom marker.- See Also:
-
getMarker
Returns the data point marker.- See Also:
-
setMarkerSize
public void setMarkerSize(double size) Sets the marker size.The default marker size is 6 pixels.
-
getMarkerSize
public double getMarkerSize()Returns the marker size.- See Also:
-
setMarkerPen
Sets the marker pen.Overrides the pen used for stroking the marker. By default the marker pen is the same as
getPen(). Calling this method automatically adds CustomMarkerPen to the custom flags.- See Also:
-
getMarkerPen
Returns the marker pen.- See Also:
-
setMarkerBrush
Sets the marker brush.Overrides the brush used for filling the marker. By default the marker brush is the same as
getBrush(). Calling this method automatically adds CustomMarkerBrush to the custom flags.- See Also:
-
getMarkerBrush
Returns the marker brush.- See Also:
-
setLegendEnabled
public void setLegendEnabled(boolean enabled) Enables the entry for this series in the legend.When enabled, this series is added to the chart legend.
The default value is true.
-
isLegendEnabled
public boolean isLegendEnabled()Returns whether this series has an entry in the legend.- See Also:
-
setLabelsEnabled
Enables a label that is shown at the series data points.You may enable labels for the
Axis.X,Axis.Yor both axes. The label that is displayed is the corresponding value on that axis. If both labels are enabled then they are combined in a single text using the format: "<x-value>: <y-value>".The default values are false for both axes (no labels).
- See Also:
-
setLabelsEnabled
Enables a label that is shown at the series data points. -
isLabelsEnabled
Returns whether labels are enabled for the given axis. -
setLabelColor
Sets the label color.Specify the color used for the rendering labels at the data points.
-
getLabelColor
Returns the label color.- See Also:
-
setHidden
public void setHidden(boolean hidden) Hide/unhide this series.A hidden series will not be show in the chart and legend.
-
isHidden
public boolean isHidden()Return whether the series is hidden.- See Also:
-
mapFromDevice
Maps from device coordinates to model coordinates.Maps a position in the chart back to model coordinates, for data in this data series.
This uses WChart::mapFromDevice() passing the
getAxis()to which this series is bound.This method uses the axis dimensions that are based on the latest chart rendering. If you have not yet rendered the chart, or wish to already the mapping reflect model changes since the last rendering, you should call
WCartesianChart#initLayout()first. -
mapToDevice
Maps from model values to device coordinates.Maps model values to device coordinates, for data in this data series.
This uses WChart::mapToDevice() passing the
getAxis()to which this series is bound.This method uses the axis dimensions that are based on the latest chart rendering. If you have not yet rendered the chart, or wish to already the mapping reflect model changes since the last rendering, you should call
WCartesianChart#initLayout()first.- See Also:
-
mapToDevice
Maps from model values to device coordinates.Returns
mapToDevice(xValue, yValue, 0) -
setOffset
public void setOffset(double offset) Set an offset to draw the data series at.The Y position of the data series will be drawn at an offset, expressed in model coordinates. The axis labels won't follow the same offset.
The offset can be manipulated client side using a mouse or touch drag if
WCartesianChart.isCurveManipulationEnabled()is enabled.Note: This is only supported for axes with linear scale.
-
getOffset
public double getOffset()Get the offset for this data series.- See Also:
-
setScale
public void setScale(double scale) Set the scale to draw the data series at.The Y position of the data series will be scaled around the zero position, and offset by
getOffset().The scale can be manipulated client side using the scroll wheel or a pinch motion if
WCartesianChart.isCurveManipulationEnabled()is enabled.Note: This is only supported for axes with linear scale.
-
getScale
public double getScale()Get the scale for this data series.- See Also:
-
setModel
Set a model for this data series.If no model is set for this data series, the model of the chart will be used.
Note: Individual models per data series are only supported for
ChartType.Scattertype charts. -
getModel
Get the model for this data series.This will return the model set for this data series, if it is set.
If no model is set for this data series, and the series is associated with a chart, the model of the chart is returned.
If no model is set for this data series, and the series is not associated with any data series, this will return null.
-
getChart
-