Class WAxis
A cartesian chart has two or three axes: an X axis (Axis.X), a Y axis (Axis.Y)
and optionally a second Y axis (Axis.Y2). Each of the up to three axes in a cartesian
chart has a unique getId() that identifies which of these three axes it is
in the enclosing chart().
Use setVisible() to change the visibility of an
axis, setGridLinesEnabled() to show grid lines
for an axis. The pen styles for rendering the axis or grid lines may be changed using setPen() and setGridLinesPen(). A
margin between the axis and the main plot area may be configured using setMargin().
By default, the axis will automatically adjust its range so that all data will be visible. You
may manually specify a range using setMinimum(),
setMaximum or setRange(). The interval
between labels is by default automatically adjusted depending on the axis length and the range,
but may be manually specified using setLabelInterval().
The axis has support for being "broken", to support displaying data with a few
outliers which would otherwise swamp the chart. This is not done automatically, but instead you
need to use setBreak() to specify the
value range that needs to be omitted from the axis. The omission is rendered in the axis and in
bars that cross the break.
The labels are shown using a "%.4g" format string for numbers, and a suitable format
for AxisScale.Date or AxisScale.DateTime scales, based on heuristics. The format
may be customized using setLabelFormat(). The
angle of the label text may be changed using setLabelAngle(). By default, all labels are printed horizontally.
- See Also:
-
Nested Class Summary
Nested ClassesModifier and TypeClassDescriptionstatic interfaceA label transform function.protected static classRepresents a label/tick on the axis. -
Field Summary
FieldsModifier and TypeFieldDescriptionstatic final doubleConstant which indicates automatic maximum calculation.static final doubleConstant which indicates automatic minimum calculation. -
Constructor Summary
Constructors -
Method Summary
Modifier and TypeMethodDescriptionprotected WStringautoDateFormat(WDate dt, DateTimeUnit unit, boolean atTick) Returns the Date format.doublecalcMaxTickLabelSize(WPaintDevice d, Orientation orientation) doublecalcTitleSize(WPaintDevice d, Orientation orientation) Returns the limits that are calculated automatically.Returns the pen used for rendering the grid lines.getId()Returns the axis id.getLabel(double u) Returns the label for a value.doubleReturns the label angle.doubleReturns the base point for labels.Returns the axis label font.Returns the label format string.doubleReturns the label interval.protected voidgetLabelTicks(List<WAxis.TickLabel> ticks, int segment, AxisConfig config) Returns the label (and ticks) information for this axis.getLabelTransform(AxisValue side) Get the label transform configured for the given side.Returns the axis location.intReturns the margin between the axis and the plot area.doubleReturns the maximum value displayed on the axis.doubleGet the maximum zoom range for this axis.doubleDeprecated.doubleReturns the minimum value displayed on the axis.doubleGet the minimum zoom range for this axis.doubleDeprecated.UsegetMaximumZoomRange()insteadintReturns the padding between the chart area and this axis.doublegetPan()Deprecated.UsegetZoomMinimum()instead.getPen()Returns the pen used for rendering the axis and ticks.doubleReturns the axis resolution.Returns whether limits should be rounded.getScale()Returns the scale of the axis.intdoubleReturns the pen used for rendering labels for this axis.Gets the direction that the axis ticks point to.getTitle()Returns the axis title.Returns the axis title font.doubleReturns the title offset.Returns the title orientation.intReturns the X axis id.intReturns the Y axis id.doublegetZoom()Deprecated.UsegetZoomMinimum()andgetZoomMaximum()instead.doubleGet the zoom range maximum for this axis.doubleGet the zoom range minimum for this axis.gridLinePositions(AxisConfig config) booleanReturns whether gridlines are displayed for this axis.booleanGet whether this axis is inverted.booleanReturns whether soft label clipping is enabled.booleanReturns whether this axis is visible.final voidrender(WPainter painter, EnumSet<AxisProperty> properties, WPointF axisStart, WPointF axisEnd, double tickStart, double tickEnd, double labelPos, EnumSet<AlignmentFlag> labelFlags) final voidrender(WPainter painter, EnumSet<AxisProperty> properties, WPointF axisStart, WPointF axisEnd, double tickStart, double tickEnd, double labelPos, EnumSet<AlignmentFlag> labelFlags, WTransform transform) voidrender(WPainter painter, EnumSet<AxisProperty> properties, WPointF axisStart, WPointF axisEnd, double tickStart, double tickEnd, double labelPos, EnumSet<AlignmentFlag> labelFlags, WTransform transform, AxisValue side) voidrender(WPainter painter, EnumSet<AxisProperty> properties, WPointF axisStart, WPointF axisEnd, double tickStart, double tickEnd, double labelPos, EnumSet<AlignmentFlag> labelFlags, WTransform transform, AxisValue side, List<WPen> pens, List<WPen> textPens) final voidsetAutoLimits(AxisValue location, AxisValue... locations) Let the minimum and/or maximum be calculated from the data.voidsetAutoLimits(EnumSet<AxisValue> locations) Let the minimum and/or maximum be calculated from the data.voidsetBreak(double minimum, double maximum) Specifies a range that needs to be omitted from the axis.voidsetGridLinesEnabled(boolean enabled) Sets whether gridlines are displayed for this axis.voidsetGridLinesPen(WPen pen) Changes the pen used for rendering the grid lines.final voidSet whether this axis should be inverted.voidsetInverted(boolean inverted) Set whether this axis should be inverted.voidsetLabelAngle(double angle) Sets the label angle.voidsetLabelBasePoint(double labelBasePoint) Sets a point to be included as one of the labels (if possible).voidsetLabelFont(WFont labelFont) Sets the axis label font.voidsetLabelFormat(CharSequence format) Sets the label format.voidsetLabelInterval(double labelInterval) Sets the label interval.voidsetLabelTransform(WAxis.LabelTransform transform, AxisValue side) Set the transform function to apply to a given side.voidsetLocation(AxisValue location) Sets the axis location.voidsetMargin(int pixels) Sets the margin between the axis and the plot area.voidsetMaximum(double maximum) Sets the maximum value for the axis displayed on the axis.voidsetMaximumZoomRange(double size) Sets the maximum zoom range for this axis.voidsetMaxZoom(double maxZoom) Deprecated.UsesetMinimumZoomRange()insteadvoidsetMinimum(double minimum) Sets the minimum value displayed on the axis.voidsetMinimumZoomRange(double size) Sets the minimum zoom range for this axis.voidsetMinZoom(double minZoom) Deprecated.UsesetMaximumZoomRange()insteadvoidsetPadding(int padding) Sets the padding between the chart area and this axis.voidsetPan(double pan) Deprecated.UsesetZoomRange()instead.voidChanges the pen used for rendering the axis and ticks.voidsetRange(double minimum, double maximum) Sets the axis range (minimum and maximum values) manually.voidsetResolution(double resolution) Sets the axis resolution.final voidsetRoundLimits(AxisValue location, AxisValue... locations) Specifies whether limits should be rounded.voidsetRoundLimits(EnumSet<AxisValue> locations) Specifies whether limits should be rounded.voidSets the scale of the axis.voidsetSoftLabelClipping(boolean enabled) Enables soft clipping of axis labels.voidsetTextPen(WPen pen) Changes the pen used for rendering labels for this axis.voidsetTickDirection(TickDirection direction) Sets the direction that the axis ticks should point to.voidsetTitle(CharSequence title) Sets the axis title.voidsetTitleFont(WFont titleFont) Sets the axis title font.voidsetTitleOffset(double offset) Sets the offset from the axis for the title label.voidsetTitleOrientation(Orientation orientation) Sets the title orientation.voidsetVisible(boolean visible) Sets whether this axis is visible.voidsetZoom(double zoom) Deprecated.UsesetZoomRange()instead.voidsetZoomRange(double minimum, double maximum) Set the range to zoom to on this axis.A signal triggered when the zoom range is changed on the client side.
-
Field Details
-
AUTO_MINIMUM
public static final double AUTO_MINIMUMConstant which indicates automatic minimum calculation. -
AUTO_MAXIMUM
public static final double AUTO_MAXIMUMConstant which indicates automatic maximum calculation.
-
-
Constructor Details
-
WAxis
public WAxis()Constructor.
-
-
Method Details
-
getId
Returns the axis id.- See Also:
-
getXAxisId
public int getXAxisId()Returns the X axis id.Returns 0 if this axis is not a X axis.
- See Also:
-
getYAxisId
public int getYAxisId()Returns the Y axis id.Returns 0 if this axis is not a Y axis.
- See Also:
-
setVisible
public void setVisible(boolean visible) Sets whether this axis is visible.Changes whether the axis is displayed, including ticks and labels. The rendering of the grid lines is controlled separately by
setGridLinesEnabled().The default value is true for the X axis and first Y axis, but false for the second Y axis.
- See Also:
-
isVisible
public boolean isVisible()Returns whether this axis is visible.- See Also:
-
setLocation
Sets the axis location.Configures the location of the axis, relative to values on the other axis (i.e. Y values for the X axis, and X values for the Y axis).
The default value is
AxisValue.Minimum.- See Also:
-
getLocation
Returns the axis location.- See Also:
-
setScale
Sets the scale of the axis.For the X scale in a
ChartType.Category, the scale should be left unchanged toAxisScale.Discrete.For all other axes, the default value is
AxisScale.Linear, but this may be changed toAxisScale.LogorAxisScale.Date.AxisScale.Dateis only useful for the X axis in aChartType.Scatterwhich containsWDatevalues.- See Also:
-
getScale
Returns the scale of the axis.- See Also:
-
setMinimum
public void setMinimum(double minimum) Sets the minimum value displayed on the axis.By default, the minimum and maximum values are determined automatically so that all the data can be displayed.
The numerical value corresponding to a data point is defined by it's AxisScale type.
-
getMinimum
public double getMinimum()Returns the minimum value displayed on the axis.This returned the minimum value that was set using
setMinimum(), or otherwise the automatically calculated (and rounded) minimum.The numerical value corresponding to a data point is defined by it's AxisScale type.
-
setMaximum
public void setMaximum(double maximum) Sets the maximum value for the axis displayed on the axis.By default, the minimum and maximum values are determined automatically so that all the data can be displayed.
The numerical value corresponding to a data point is defined by it's AxisScale type.
-
getMaximum
public double getMaximum()Returns the maximum value displayed on the axis.This returned the maximum value that was set using
setMaximum(), or otherwise the automatically calculated (and rounded) maximum.The numerical value corresponding to a data point is defined by it's AxisScale type.
-
setRange
public void setRange(double minimum, double maximum) Sets the axis range (minimum and maximum values) manually.Specifies both minimum and maximum value for the axis. This automatically disables automatic range calculation.
The numerical value corresponding to a data point is defined by it's AxisScale type.
-
setResolution
public void setResolution(double resolution) Sets the axis resolution.Specifies the axis resolution, in case maximum-minimum < resolution minimum and maximum are modified so the maximum - minimum = resolution
The default resolution is 0, which uses a built-in epsilon.
- See Also:
-
getResolution
public double getResolution()Returns the axis resolution.- See Also:
-
setAutoLimits
Let the minimum and/or maximum be calculated from the data.Using this method, you can indicate that you want to have automatic limits, rather than limits set manually using
setMinimum()orsetMaximum().locationscan beAxisValue.Minimumand/orAxisValue.Maximum.The default value is
AxisValue.Minimum|AxisValue.Maximum. -
setAutoLimits
Let the minimum and/or maximum be calculated from the data. -
getAutoLimits
Returns the limits that are calculated automatically.This returns the limits (
AxisValue.Minimumand/orAxisValue.Maximum) that are calculated automatically from the data, rather than being specified manually usingsetMinimum()and/orsetMaximum().- See Also:
-
setRoundLimits
Specifies whether limits should be rounded.When enabling rounding, this has the effect of rounding down the minimum value, or rounding up the maximum value, to the nearest label interval.
By default, rounding is enabled for an auto-calculated limited, and disabled for a manually specifed limit.
- See Also:
-
setRoundLimits
Specifies whether limits should be rounded. -
getRoundLimits
Returns whether limits should be rounded.- See Also:
-
setBreak
public void setBreak(double minimum, double maximum) Specifies a range that needs to be omitted from the axis.This is useful to display data with a few outliers which would otherwise swamp the chart. This is not done automatically, but instead you need to use
setBreak()to specify the value range that needs to be omitted from the axis. The omission is rendered in the axis and inSeriesType.Barthat cross the break.Note: This feature is incompatible with the interactive features of
WCartesianChart. -
setLabelInterval
public void setLabelInterval(double labelInterval) Sets the label interval.Specifies the interval for displaying labels (and ticks) on the axis. The default value is 0.0, and indicates that the interval should be computed automatically.
The unit for the label interval is in logical units (i.e. the same as minimum or maximum).
- See Also:
-
getLabelInterval
public double getLabelInterval()Returns the label interval.- See Also:
-
setLabelBasePoint
public void setLabelBasePoint(double labelBasePoint) Sets a point to be included as one of the labels (if possible).The given point will be included as one of the labels, by adjusting the minimum value on the axis, if that minimum is auto-computed. This is only applicable to a Linear scale axis.
The default value is 0.0.
- See Also:
-
getLabelBasePoint
public double getLabelBasePoint()Returns the base point for labels.- See Also:
-
setLabelFormat
Sets the label format.Sets a format string which is used to format values, both for the axis labels as well as data series values (see
WDataSeries#setLabelsEnabled()).For an axis with a
AxisScale.LinearorAxisScale.Logscale, the format string must be a format string that is accepted by snprintf() and which formats one double. If the format string is an empty string, then WLocale::toString() is used.For an axis with a
AxisScale.Datescale, the format string must be a format string accepted byWDate.toString(), to format a date. If the format string is an empty string, a suitable format is chosen based on heuristics.For an axis with a
AxisScale.DateTimescale, the format string must be a format string accepted byWDateTime#toString(), to format a date. If the format string is an empty string, a suitable format is chosen based on heuristics.The default value is "%.4g" for a numeric axis, and a suitable format for date(time) scales based on a heuristic taking into account the current axis range.
- See Also:
-
getLabelFormat
Returns the label format string.- See Also:
-
setLabelAngle
public void setLabelAngle(double angle) Sets the label angle.Sets the angle used for displaying the labels (in degrees). A 0 angle corresponds to horizontal text.
The default value is 0.0.
- See Also:
-
getLabelAngle
public double getLabelAngle()Returns the label angle.- See Also:
-
setTitleOrientation
Sets the title orientation.Sets the orientation used for displaying the title.
The default value is
Orientation.Horizontal- See Also:
-
getTitleOrientation
Returns the title orientation. -
setGridLinesEnabled
public void setGridLinesEnabled(boolean enabled) Sets whether gridlines are displayed for this axis.When enabled, gird lines are drawn for each tick on this axis, using the
getGridLinesPen().Unlike all other visual aspects of an axis, rendering of the gridlines is not controlled by setDisplayEnabled().
-
isGridLinesEnabled
public boolean isGridLinesEnabled()Returns whether gridlines are displayed for this axis.- See Also:
-
setPen
Changes the pen used for rendering the axis and ticks.The default value is a
StandardColor.Blackpen of 0 width.- See Also:
-
getPen
Returns the pen used for rendering the axis and ticks.- See Also:
-
setTextPen
Changes the pen used for rendering labels for this axis.The default value is a
StandardColor.Blackpen of 0 width. -
getTextPen
Returns the pen used for rendering labels for this axis.- See Also:
-
setGridLinesPen
Changes the pen used for rendering the grid lines.The default value is a
StandardColor.Graypen of 0 width.- See Also:
-
getGridLinesPen
Returns the pen used for rendering the grid lines.- See Also:
-
setMargin
public void setMargin(int pixels) Sets the margin between the axis and the plot area.The margin is defined in pixels.
The default value is 0.
- See Also:
-
getMargin
public int getMargin()Returns the margin between the axis and the plot area.- See Also:
-
setTitle
Sets the axis title.The default title is empty.
- See Also:
-
getTitle
Returns the axis title.- See Also:
-
setTitleFont
Sets the axis title font.The default title font is a 12 point Sans Serif font.
- See Also:
-
getTitleFont
Returns the axis title font.- See Also:
-
setTitleOffset
public void setTitleOffset(double offset) Sets the offset from the axis for the title label. -
getTitleOffset
public double getTitleOffset()Returns the title offset. -
setLabelFont
Sets the axis label font.The default label font is a 10 point Sans Serif font.
- See Also:
-
getLabelFont
Returns the axis label font.- See Also:
-
getLabel
Returns the label for a value.This returns the label text that corresponds to a given value.
The default implementation uses the
getLabelFormat()to properly represent the value. -
setZoomRange
public void setZoomRange(double minimum, double maximum) Set the range to zoom to on this axis.The minimum is the lowest value to be displayed, and the maximum is the highest value to be displayed.
If the difference between minimum and maximum is less than
getMinimumZoomRange(), the zoom range will be made more narrow around the center of minimum and maximum.If the given minimum is larger than the given maximum, the two values are swapped.
Only applies to a
WCartesianChartin interactive mode. -
getZoomMinimum
public double getZoomMinimum()Get the zoom range minimum for this axis.Only applies to a
WCartesianChartin interactive mode. -
getZoomMaximum
public double getZoomMaximum()Get the zoom range maximum for this axis.Only applies to a
WCartesianChartin interactive mode. -
zoomRangeChanged
A signal triggered when the zoom range is changed on the client side.Only applies to a
WCartesianChartin interactive mode.Note: If you want to use this signal, you must connect a signal listener before the chart is rendered.
-
setZoom
public void setZoom(double zoom) Deprecated.UsesetZoomRange()instead.Sets the zoom level for this axis.Only applies to a
WCartesianChartin interactive mode. The zoom level should be >= 1 and smaller thangetMaxZoom() -
getZoom
public double getZoom()Deprecated.UsegetZoomMinimum()andgetZoomMaximum()instead.Get the zoom level for this axis.Only applies to a
WCartesianChartin interactive mode.- See Also:
-
setMaxZoom
public void setMaxZoom(double maxZoom) Deprecated.UsesetMinimumZoomRange()insteadSets the maximum zoom level for this axis.Only applies to a
WCartesianChartin interactive mode. The zoom level should be >= 1 (1 = no zoom). -
getMaxZoom
public double getMaxZoom()Deprecated.UsegetMinimumZoomRange()insteadGet the maximum zoom level for this axis.Only applies to a
WCartesianChartin interactive mode.- See Also:
-
setMinimumZoomRange
public void setMinimumZoomRange(double size) Sets the minimum zoom range for this axis.Only applies to a
WCartesianChartin interactive mode.This range is the smallest difference there can be between
getZoomMinimum()andgetZoomMaximum(). -
getMinimumZoomRange
public double getMinimumZoomRange()Get the minimum zoom range for this axis.Only applies to a
WCartesianChartin interactive mode.- See Also:
-
setMaximumZoomRange
public void setMaximumZoomRange(double size) Sets the maximum zoom range for this axis.Only applies to a
WCartesianChartin interactive mode.This range is the largest difference there can be between
getZoomMinimum()andgetZoomMaximum().This is especially useful in combination with
on demand loading, when showing the entire chart is undesirable because the amount of data to be shown is too large. -
getMaximumZoomRange
public double getMaximumZoomRange()Get the maximum zoom range for this axis.Only applies to a
WCartesianChartin interactive mode.- See Also:
-
setMinZoom
public void setMinZoom(double minZoom) Deprecated.UsesetMaximumZoomRange()insteadSets the minimum zoom level for this axis.Only applies to a
WCartesianChartin interactive mode. The zoom level should be >= 1 (1 = no zoom). -
getMinZoom
public double getMinZoom()Deprecated.UsegetMaximumZoomRange()insteadGet the minimum zoom level for this axis.Only applies to a
WCartesianChartin interactive mode.- See Also:
-
setPan
public void setPan(double pan) Deprecated.UsesetZoomRange()instead.Sets the value to pan to for this axis.This sets the leftmost (horizontal axis) or bottom (vertical axis) value to be displayed on the chart.
Note that if this would cause the chart to go out of bounds, the panning of the chart will be automatically adjusted.
Only applies to a
WCartesianChartin interactive mode.Note: If the pan position has been changed on the client side, this may not reflect the actual pan position.
-
getPan
public double getPan()Deprecated.UsegetZoomMinimum()instead.Get the value to pan to for this axis, when pan is enabled on the chart.Only applies to a
WCartesianChartin interactive mode.- See Also:
-
setPadding
public void setPadding(int padding) Sets the padding between the chart area and this axis.- See Also:
-
getPadding
public int getPadding()Returns the padding between the chart area and this axis.- See Also:
-
setTickDirection
Sets the direction that the axis ticks should point to.If set to
TickDirection.Outwards, the axis ticks will point outside of the chart, and the labels will be on the outside.If set to
TickDirection.Inwards, the axis ticks will point inside of the chart, and the labels will be on the inside. Also, thegetPadding()will be set to 25.- See Also:
-
getTickDirection
Gets the direction that the axis ticks point to. -
setSoftLabelClipping
public void setSoftLabelClipping(boolean enabled) Enables soft clipping of axis labels.This is set to
falseby for a 3D chart and totruefor a 2D chart.This setting determines how labels should be clipped in case not the entire axis is visible due to clipping. "Hard" clipping is done by the paint device and may truncate labels. "Soft" clipping will determine if the corresponding tick is visible, and draw the label (unclipped), preventing labels from being truncated. For a 2D chart, this feature is only relevant when
zoom is enabledon aWCartesianChart.This is the default for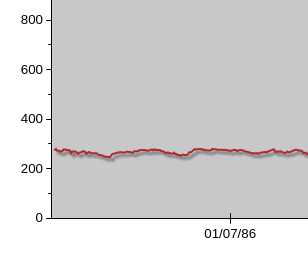
Soft clipping enabled (slower).
WCartesianChart. The tick for 0 is visible, and the 0 is shown completely. The tick for 01/01/86 is not visible, so its label is not shown.The tick of the 0 is visible, but the 0 is shown partially. Also, the tick of 01/01/86 is not visible, but the label is partially shown.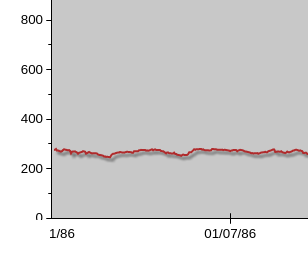
Soft clipping disabled (faster).
-
isSoftLabelClipping
public boolean isSoftLabelClipping()Returns whether soft label clipping is enabled. -
getSegmentCount
public int getSegmentCount() -
getSegmentMargin
public double getSegmentMargin() -
render
public void render(WPainter painter, EnumSet<AxisProperty> properties, WPointF axisStart, WPointF axisEnd, double tickStart, double tickEnd, double labelPos, EnumSet<AlignmentFlag> labelFlags, WTransform transform, AxisValue side) -
render
public final void render(WPainter painter, EnumSet<AxisProperty> properties, WPointF axisStart, WPointF axisEnd, double tickStart, double tickEnd, double labelPos, EnumSet<AlignmentFlag> labelFlags) -
render
public final void render(WPainter painter, EnumSet<AxisProperty> properties, WPointF axisStart, WPointF axisEnd, double tickStart, double tickEnd, double labelPos, EnumSet<AlignmentFlag> labelFlags, WTransform transform) -
render
public void render(WPainter painter, EnumSet<AxisProperty> properties, WPointF axisStart, WPointF axisEnd, double tickStart, double tickEnd, double labelPos, EnumSet<AlignmentFlag> labelFlags, WTransform transform, AxisValue side, List<WPen> pens, List<WPen> textPens) -
gridLinePositions
-
setInverted
public void setInverted(boolean inverted) Set whether this axis should be inverted.When inverted, the axis will be drawn in the opposite direction, e.g. if normally, the low values are on the left and high values on the right, when inverted, the low values will be on the right and high values on the left.
-
setInverted
public final void setInverted()Set whether this axis should be inverted.Calls
setInverted(true) -
isInverted
public boolean isInverted()Get whether this axis is inverted.- See Also:
-
setLabelTransform
Set the transform function to apply to a given side.The label transform must be a function from double to double, and will be applied on the double value of the model coordinate of every axis tick.
The label transform will not move the position of the axis ticks, only change the labels displayed at the ticks.
This can be useful in combination with a
getLocation()set toAxisValue.Both, to show different labels on each side.If
AxisScale.DateorAxisScale.DateTimeare used, the double value will be in seconds since the Epoch (00:00:00 UTC, January 1, 1970).Only
AxisValue.Minimum,AxisValue.ZeroandAxisValue.Maximumare accepted for side. If you set a label transform for another side, the label transform will not be used.The label transform will not be used if the
getScale()isAxisScale.Discrete. -
getLabelTransform
Get the label transform configured for the given side.If no transform is configured for the given side, the identity function is returned.
-
calcTitleSize
-
calcMaxTickLabelSize
-
getLabelTicks
Returns the label (and ticks) information for this axis. -
autoDateFormat
Returns the Date format.
-
getMinimumZoomRange()instead